Responsive web applications need to work consistently in various environments on different devices.
This post describes tools that help find and trace down bugs across platforms.
Chrome Emulation
The first step to test a responsive site is to use Chrome’s mobile emulation tools, which simulate the screen and touch interface of a phone or tablet. They can be found in Chrome’s console drawer, which can be opened like this:
- Open the Developer Tools, for example by right-clicking on the page and selecting ‘Inspect Element’
- Click the button next to the Settings gear icon to show the Console Drawer (or just press Escape)

In the drawer you can find an Emulation tab. (If you don’t see it you’ll need to enable it in the Console settings.)
There are four different sections on the side of the tab. When a device is selected in the first section the settings in the other three sections are updated with the properties of the device.
When you change the emulated device you need to reload the page before all changes are applied. Refreshing the page ensures that the updated user agent string is sent to the server when the page is loaded. (The user agent string tells the server what browser is requesting the content, so the server can tailor the response to the capabilites of the browser.)

In addition to simulating a different screen size the emulation also changes the device pixel ratio, which allows you to test that high-resolution retina images are loading correctly if the device supports them.
Chrome will also change the cursor to a circle, showing that clicking will trigger a touch event. The Sensor tab also allows you to modify how the browser reports the user’s geographic location.
Network throttling
Network throttling is built into the current Chrome Canary build and will probably become available in the stable Chrome version soon.
This feature allows you to try out how long a page takes to load on a mobile internet connection.

Using virtual machines (VMs) to test in Internet Explorer
While Firefox and Safari run on both OS X and Windows, Internet Explorer doesn’t. Testing on different operating systems also shows how features like different scroll bar behavior or installed fonts affect the page.
If you use a Mac and want to verify that a website works in IE you can use a virtual machine that simulates a physical computer running Windows. Microsoft provides disk images with different versions of Windows and Internet Explorer at modern.ie. You can import them into VirtualBox or VMWare.

If you want to access the host machine’s localhost inside the VM, launch Internet Explorer and enter the IP address 10.0.2.2 into the location bar.
Internet Explorer contains some tools for emulating the behavior of older versions of IE. While they aren’t guaranteed to be correct they usually allow you to spot many of the issues you’d run into when trying to load the page in the real version.
Testing on real devices and accessing the local development server
When a device is connected to a network it usually has access to websites that are hosted locally on computers on the same local network.
That way you can easily access the development version of a website from a phone or Windows computer. To do that you need to find the local IP address of the development server and enter it in your browser.
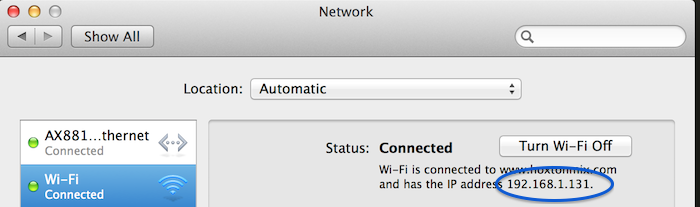
Finding your machine’s local IP address on OS X
- In the Apple menu open System Preferences
- Open the Network menu
- Select the network that you’re connected to
You’re looking for the IP address, it usually starts with ‘192.168’. Where it’s located depends on whether you are using wifi or ethernet.
Finding your machine’s local IP address on Windows
- Open the Control Panel
- Go to the Network and Sharing Center
- Click on the Local Area Connection
- Click Details
- Look for the IPv4 address
If accessing that IP address from another device doesn’t work you might need to update Window’s firewall settings.
Debugging on Modern Phones
Modern phones allow you to attach your phone to a computer and use the full browser debugging tools that are normally available. For example, you can inspect the DOM, see logging output and step through the code line by line.
iOS
To debug a page on an iPhone or iPad you first need to enable remote debugging on the mobile device and on your computer.
On the phone or tablet go to Settings > Safari > Advanced, and toggle the Web Inspector.
Then, open Safari on a Mac and go to Preferences in the menu. Open the Advanced tab and check ‘Show Develop menu in menu bar’.
Now connect your devices via USB and open a website in iOS Safari.
You will see a Develop menu item in Safari on your development machine. Open it, select the mobile device, and click on the website you want to inspect.
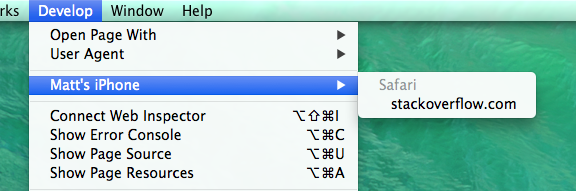
You can now see page’s console output as well as use the UI inspector and the Javascript debugger.
Initially Safari won’t show you Javascript code in the debugging tab. First, you have to select the relevant Javascript file in the Resources tab and add a breakpoint there.
Android
I’m not familiar with Android remote debugging, but it can be done on newer phones that are able to run Chrome. See the Chrome Developer Tools for more information.
Device Emulators
Instead of attaching to real hardware you can also attach the debugging tools to a simulator.
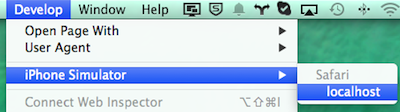
For example, you can run Xcode’s iOS Simulator, load a website in it and inspect it from Safari in OS X.
In this case you can access localhost on the simulated device as you would on your computer - just type “localhost” in the URL bar.
It’s also possible to attach Chrome to an Android emulator, but it seems to be less straightforward.
Testing on older Phones
Viewing Error Messages
Some older phones allow you to view errors that occurred on the currently opened page directly in the browser. For example, in older versions of iOS Safari you can enable a Debug Console in the settings that will show you any Javascript exceptions and console output.

Inspecting the DOM
Weinre allows you to inspect the DOM even if there is no native support to attach a debugger.
You can install it yourself, but it’s quicker to get started with the version hosted by PhoneGap. To communicate with the page Weinre needs you to insert a script tag into the page you want to debug. Then you can open the HTML inspector in Safari. (I initially tried Chrome, but it didn’t work for me.)
Weinre also lets you see console output and run Javascript commands on the inspected page.
Step-by-step Javascript debugging
To step through code on old devices you can use Aardwolf. It requires some server setup because it needs to modify Javascript files when they are fetched from the server, in order to identify the current position in the code and give you access to variables in local scope.

Testing with Browserstack
It’s often impractical to have a virtual machine for every target environment available to all testers. In those case you can use Browserstack to access a VM in your browser. In the VM you can access your website, check if it works, and use the browser’s debugging tools.
Browserstack supports different versions of desktop browsers on OS X and Windows, as well as many iOS and Android phones and tablets.
You can also set it up to serve content from your development machine. That makes it possible to quickly verify that fixes were successful.

When none of these tools help to identify the problem
If it takes a lot of time to trace down an issue on an older device consider moving on to other devices and revisiting the previous device later - the error might have been identified and fixed on a newer device by then. You can also try another older device that has better tools, even if you don’t plan to support it, as might still give valueable hints about what’s going wrong.
If that doesn’t help, maybe some simplifications are necessary on the older device or some features can’t be available on it if costs exceed the advantages of full support.
