Unfortunately, the documentation is very sparse and sometimes out of date. The homepage tells you to use paper.g.linechart, which will give you this error:
Uncaught TypeError: Cannot call method 'linechart' of undefined(paper is the Raphael object.) The current version of g.Raphael uses paper.linechart directly:
<script src="raphael-min.js">
</script>
<script src="g.raphael-min.js">
</script>
<script src="g.line-min.js">
</script>
<div id="container">
</div>
<script>
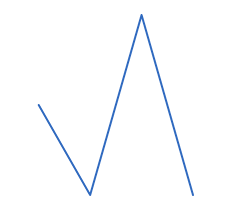
var paper = new Raphael(document.getElementById("container"));
paper.linechart(0, 0, 200, 200,
[1, 2, 3, 4],
[3, 2, 4, 2]
);
</script>
Adding axes
g.Raphael provides an axis option. It takes strings like "0 0 1 1", which will show axes at the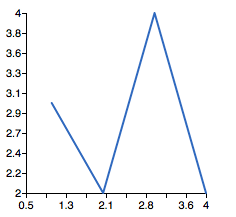
<script src="raphael-min.js">
</script>
<script src="g.raphael-min.js">
</script>
<script src="g.line-min.js">
</script>

<div id="container">
</div>
<script>
var paper = new Raphael(document.getElementById("container"));
paper.linechart(10, 0, 200, 200,
  [1, 2, 3, 4],
  [3, 2, 4, 2],
  {axis: "0 0 1 1"}
  );
</script>
