You’ve probably used a CSS generator like Sass or Less, or worked in a language like ES 2015 or CoffeeScript that is compiled to JavaScript code that the can run in the browser.
However, problems arise when you try to debug the compiled code in the browser’s debugger. The code in the browser isn’t the code that you wrote, so it’s hard to understand what’s going on.
Source maps solve this problem. They describe how the compiled code is related to your original source code. The debugger can then show the original code you wrote, while actually running the compiled code.
This article will look at what source maps actually look like and what their limitations are.
What does a source map look like?
Let’s compile this ES 2015 code with Babel:
const square = (x) => x * x;This is the compiled JavaScript code:
"use strict";

var square = function square(x) {
  return x * x;
};

//# sourceMappingURL=test.js.map
And this is the source map content inside “test.js.map”:
{
    "version": 3,
    "sources": ["test.es6.js"],
    "names": [],
    "mappings": ";;AAAA,IAAM,MAAM,GAAG,SAAT,MAAM,CAAI,CAAC;SAAK,CAAC,GAAG,CAAC;CAAA,CAAC",
    "file": "test.js",
    "sourcesContent": ["const square = (x) => x * x;"]
}
As you can see the file contains JSON data. Most of the values are straightfoward.
- Version: This is the source map standard revision that was used.
- Sources: This list contains the original file names before compilation. In this case we only have one file, but if you’re using a JavaScript bundler for a large application there would be many.
- File: Filename of the compiled code.
- Content: Content of the files specified in Sources.
However, the mapping data isn’t easy to make sense of. It uses a format called Base 64 VLQ.
Base 64 VLQ
VLQ stands for variable-length quantity, and it’s used to store a number in a more space-efficient way than storing its digits as a string.
The image below shows how to count in Base 64 VLQ.
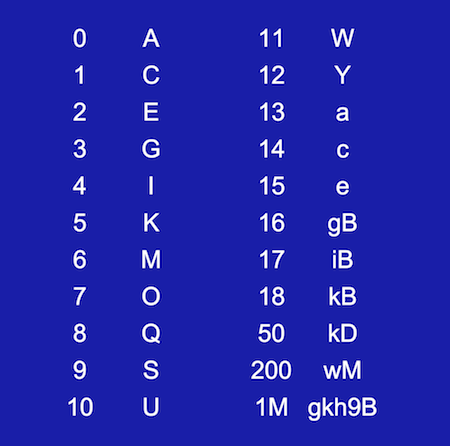
The individual mappings entries, like “AAAA” and “GAAG”, are called “segments”. They each represent an array of numbers. For example “AAAA” stands for [0,0,0,0] and “GAAG” stands for [3,0,0,3].
You can use the vlq package on NPM to encode and decode the segments.
Interpreting the mappings entries
Once we’ve got the array representation of a mapping it becomes a little easier to make sense of the source map. Each value in the array is an index that refers to a position either in the compiled source code or in the original source code.
- [0]: Column index in the compiled file
- [1]: What original source file the location in the compiled source maps to
- [2]: Row index in the original source file (i.e. the line number)
- [3]: Column index in the original source file
All positions are relative to the previous position, rather than absolute column indices.
So how does the debugger know what row/line an entry refers to in the compiled code? The mappings are separated by semi-colons, and each mapping describes one line.
You can see that the mappings value in the example start with “;;”. That’s because "use strict" and an empty line are added by Babel, even though these lines don’t relate to anything in the original file.
Interpreting the mappings value in our example
Let’s see if we can understand some more bits from the mappings value.
";;AAAA,IAAM,MAAM,GAAG,SAAT,MAAM,CAAI,CAAC;SAAK,CAAC,GAAG,CAAC;CAAA,CAAC"
Why are the middle values always “A”?
You can notice that the two middle characters are always “A”, representing the value 0. This has a simple explanation.
We only have one original source file. The debugger always takes index 0 of the Sources array above, which is “test.es6.js”.
The content of “test.es6.js” is const square = (x) => x * x;. It’s only one line, so the line index in the original file is also always 0.
Why does it mean that the first segment is “AAAA”?
This means that the compiled source column and the column in the original source are both 0. In both files the assignment starts at the beginning of the line.
What does IAAM mean?
“IAAM” represents the array [4,0,0,6]. The column indices are relative to the column from the previous segment, but because we started at column 0 the absolute column indices are also 4 and 6.
This refers to the beginning of the function name in the compiled source and in the original source code.
0|1|2|3|4|
v|a|r| |s|q|u|a|r|e|
0|1|2|3|4|5|6|
c|o|n|s|t| |s|q|u|a|r|e|
Visualizing the source map
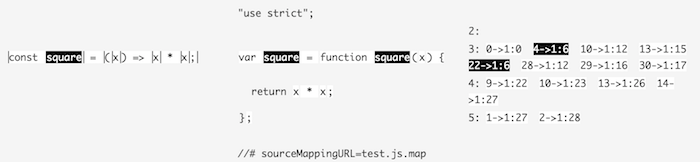
This source map visualization tool by Tobias Koppers can help you get a better understanding. See the image below for an example.
If you want to know more technical details check out this blog post and visualizer by Peter van der Zee.
Limitations of source maps
There are at least two limitations that make working with source maps harder than working directly with the original files.
- Source maps map positions in the code, but they don’t map how two variable names relate to one another.
- Optimizations can make the compiled source code not match the behavior you’d expect from the code you wrote.
Mapping relationships between variable names
If the compiler you used made changes to variable names source maps allow the debugger to show you the original names in the code panel.
However the debugger won’t give you access to the original variable names in the console, watch expressions, or the list of scope variables. Here you need to use the variable name that’s was generated by the compiler.
Likewise, hovering over a variable to see its value won’t work.
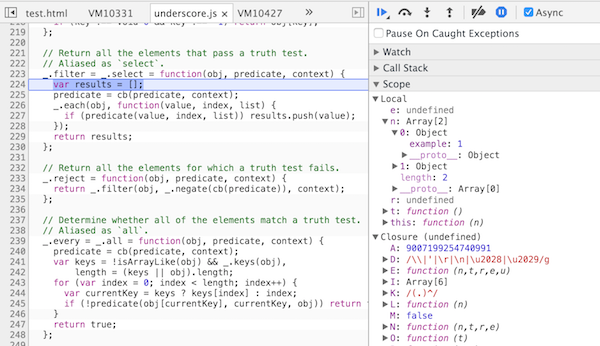
Minifiers are a common type of compiler that will change variable names. The screenshot below shows the original Underscore.js source code, but the scopes pane is showing the minified single-letter variable names.
Another example of variable renaming is using the let keyword with Babel. Babel has to rename it to get the desired scoping behavior:
var x = 55;
var someCondition = true;
if (someCondition){
    let x = 66;
}

// Babel transforms this code into:

var x = 55;
var someCondition = true;
if (someCondition) {
    var _x = 66;
}
If you look at the source map example above you might think the names property would allow you to map the variable names to one another.
However, most tools don’t use it and it doesn’t actually solve this problem.
the intention was to both deobfuscate stack traces and provide a way for de-minimization of source code if the mapping was semi-direct.
[…It] was left in primarily because it have any cost associated with it. But yes, the intent was to provide to link to the original names used for a variable.
There are now several proposals on how to approach mapping changed variable names to their original names in the next version of the source maps format.
Compiled code behaving differently in the debugger than the original code
Source maps give you the illusion that you’re debugging the code you wrote. However, the truth is that the debugger is running different code and then trying to map its behavior back to your original source code.
Sometimes makes your code behave differently from what you would expect. For example, you might try to set a breakpoint on one line but Chrome sets the breakpoint a few lines further down.
Has this ever happened to you?
While it looks like we’re stepping through three separate variable assignments the Uglify minifier has actually merged them into one.
var r = Math.random(),
    a = Math.random(),
    n = Math.random();
Chrome isn’t able to set a breakpoint in-between them anymore.
Something similar would happen if an optimizer removed an unnecessary line from your code. It’s impossible for Chrome to set a breakpoint on a line that doesn’t exist in the compiled code.
Learning more about source maps
There appears to be some interest in moving the source maps format forward and adding a way to map names to each other.
You can check out the Mozilla mailing list on source maps or have a look at the V3 specification.
