JavaScript compilation and bundling tools usually output a source map file in addition to the compiled code. A debugging tool like Chrome DevTools can then use the source map to show you the code you wrote, rather than the compiled code that Chrome is running.
DevTools can use the source map to find the correct line number of each call frame in your code. It can also use the source map to find the correct function name of each call stack item.
Logging exceptions on production lets you find out if things are breaking for your end users. You can use error.stack to get a stack trace that you want to log.
However, if all you have is a stack trace obtained from production, the debugger doesn’t help much. You can’t load the minified call frames into DevTools.
It’s very hard to work with the stack production stack trace directly. Finding column 23912 in line 1 for every call frame is going to take some time.
Luckily, a library called StackTrace.JS can help. Specifically, stacktrace-gps lets you find “a more accurate location (using source maps) and guessed function names.”
To use StackTrace.JS you need the stack trace string obtained from production and a source maps file for the code that ran on production at the time the stack trace was generated. You also need the original source code that was used to generate the compiled file.
Preparing to resolve the stack trace
First of all, download StackTrace.JS. I’m using the stacktrace.min.js file.
This build of StacktTrace.JS combines 5 different libraries: stacktrace.js, stacktrace-gps, error-stack-parser, stack-generator and stackframe. You can also use them individually, but you need to make sure the versions match, or you’ll get an issue like this.
StackTraceJS runs on the client, so we’ll need an index.html file to write our stack trace conversion code in.
Let’s start by just putting our production stack trace in there:
<script src="stacktrace.min.js"></script>
<script>
var productionStackTrace = `Error
    at render (http://localhost:6001/all.js:5:2651)
    at addOne (http://localhost:6001/all.js:5:4731)
    at http://localhost:6001/all.js:3:25511
    at Function.y.each.y.forEach (http://localhost:6001/all.js:3:26354)
    at .each (http://localhost:6001/all.js:4:8948)
    at addAll (http://localhost:6001/all.js:5:4793)
    at y (http://localhost:6001/all.js:4:12026)
    at v (http://localhost:6001/all.js:4:11760)
    at h (http://localhost:6001/all.js:4:9679)
    at c.trigger (http://localhost:6001/all.js:4:11653)`
</script>
Now, in order to resolve the stack trace, StackTrace.JS needs to have access to all the original code and source maps. That means we need to do a bit of work before we can continue.
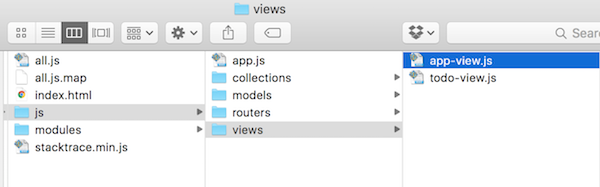
First, we need to put all the referenced code into our working directory.
You can see the production call stack mentions an “all.js” file, which has a source map file called “all.js.map”. So those two files need to be available. The source maps file also references more files like “todo-view.js”, which also need to be in the directory.
Next, let’s strip out the original domain name. In this example that’s “localhost:6001”. If we didn’t do this StackTrace.JS would try to load the files from that domain, and we’d get an error because of an unallowed the cross origin request.
productionStackTrace = productionStackTrace.replace(/http:\/\/localhost:6001\//g, "")However, if we just open the HTML file in the browser we still have a similar problem, because we can’t load local files through an XMLHTTPRequest because of security restrictions. So let’s run a local server to serve the files:
python -m SimpleHTTPServer 7500 # open at localhost:7500Now we can parse our stack trace string into individual StackFrame objects using ErrorStackParser.
var stackFrames = ErrorStackParser.parse({stack: productionStackTrace})Resolving the stack trace with StackTrace GPS
Now that our environment is set up we can use the StackTraceGPS object to do the actual StackFrame resolution. To do that we use its pinpoint function.
var gps = new StackTraceGPS()
gps.pinpoint(stackFrames[0])
    .then(function(newFrame){
        console.log(newFrame)
    }, function(err){
        console.log(err)
    })
In this case we’re just converting the first stack frame and logging the result after applying the source map data.
We’re also passing in an error handling function to display any errors. For example, we would see a cross origin error if we didn’t follow the steps above.
StackTrace.JS loads all the files it needs and then shows us the new StackFrame:
{
    functionName: "render",
    fileName: "js/views/todo-view.js",
    lineNumber: 50,
    columnNumber: 14
}
Resolving the entire stack trace string
However, in practice you’ll want to resolve all stack frames in the error stack, not just one.
Here’s the complete code to do that:
var gps = new StackTraceGPS();
var newFrames = new Array(stackFrames.length)
var frameResolved = 0;
stackFrames.forEach(function(stackFrame, i){
    gps.pinpoint(stackFrame).then(function(newFrame){
        newFrames[i] = newFrame

        frameResolved++;
        if (frameResolved === stackFrames.length){
            allFramesResolved()
        }
    }, function(){
        console.error(arguments)
    })
})

function allFramesResolved(){
    var newFrameStrings = newFrames.map(function(frame){
        return frame.toString();
    })
    console.log(newFrameStrings.join("\n"))
}
We’re going going through all the frames and keeping a count of how many of them we’ve resolved. It would be cleaner to use a library like async to handle the counting, but I’ll stay clear of additional dependencies in this example.
new Array(stackFrames.length) creates an array with an empty item for each stack frame. We can’t just use newFrames.push because there’s no guarantee that the pinpoint calls will finish in the same order they were started.
And here’s our complete resolved strack trace:
render()@js/views/todo-view.js:50:14
addOne()@js/views/app-view.js:80:26
optimizeCb()@modules/underscore/underscore.js:73:20
forEach()@modules/underscore/underscore.js:153:8
addMethod()@modules/backbone/backbone.js:87:25
addAll()@js/views/app-view.js:86:13
triggerEvents()@modules/backbone/backbone.js:370:56
triggerApi()@modules/backbone/backbone.js:356:18
eventsApi()@modules/backbone/backbone.js:155:15
trigger()@modules/backbone/backbone.js:346:4
You can see it has all the original filenames and function names.
