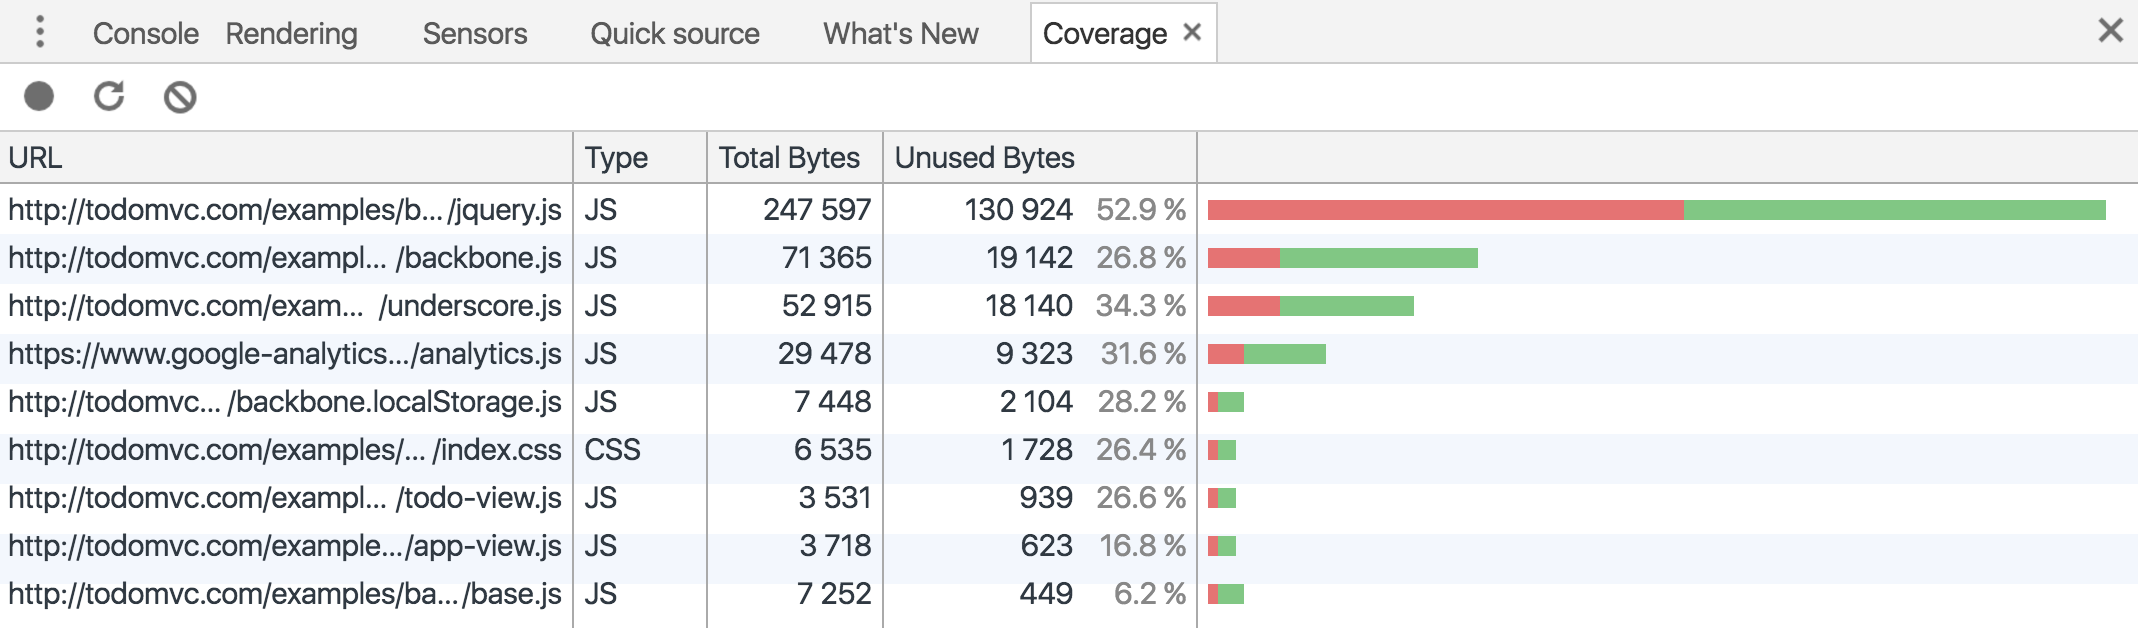
There’s a new feature in Chrome Canary: JavaScript code coverage. It tells you how much of your code is actually executed, vs how much is loaded unnecessarily.
I wondered how it’s implemented… these are my findings from bumbling through the source code with Chrome code search. It’s C++, but don’t worry, I don’t know C++ either. :)
A high level look at the code coverage feature
DevTools uses the Chrome Debugging Protocol to communicate with V8. Before looking at the Chrome code itself we can check the protocol documentation to get an idea what’s going on.
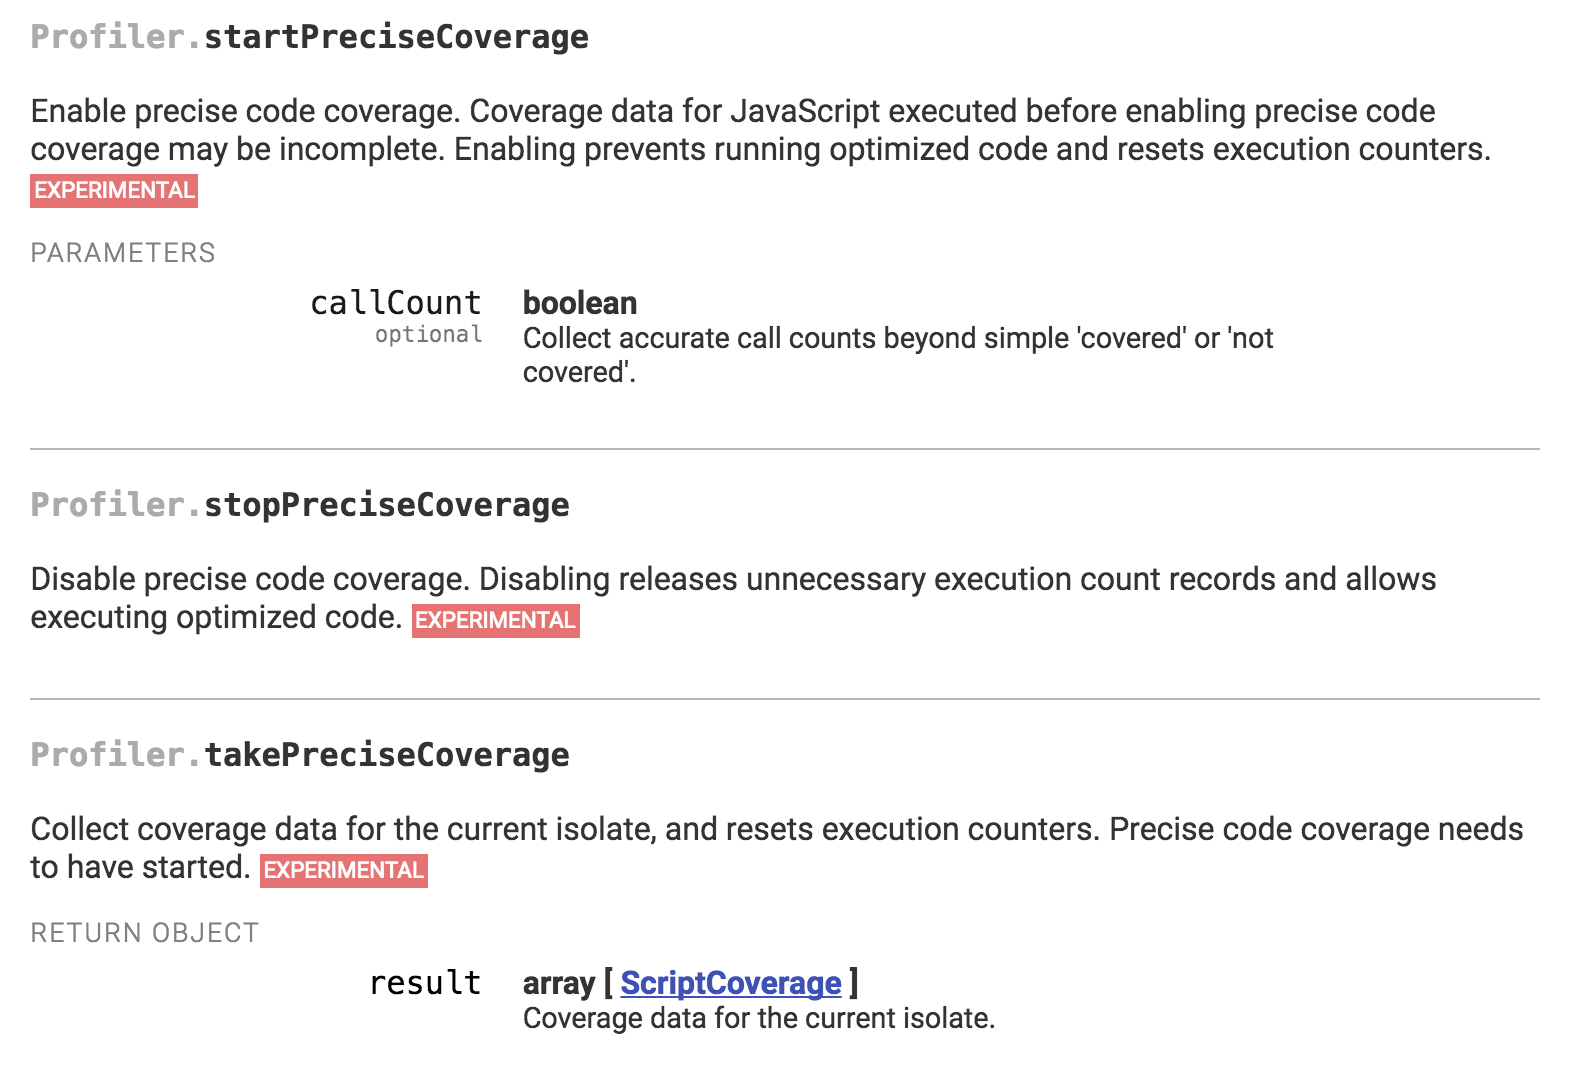
There’s a startPreciseCoverage endpoint that takes a callCount parameter. If that parameter is true V8 will count the number of times the code has run, rather than just giving a binary value.
To generate the coverage report that’s shown at the top of this post we don’t need to count the exact number of calls, we just care whether or not the code has run.
There’s also a takePreciseCoverage endpoint, but unfortunately there’s no example of what a coverage result looks like. There are two ways we can learn more.
First, we can debug the debugger and set a breakpoint after searching for takePreciseCoverage. Stepping into the call we find a dispatchResponse method where the results of requests that DevTools makes to V8/Chrome become available.
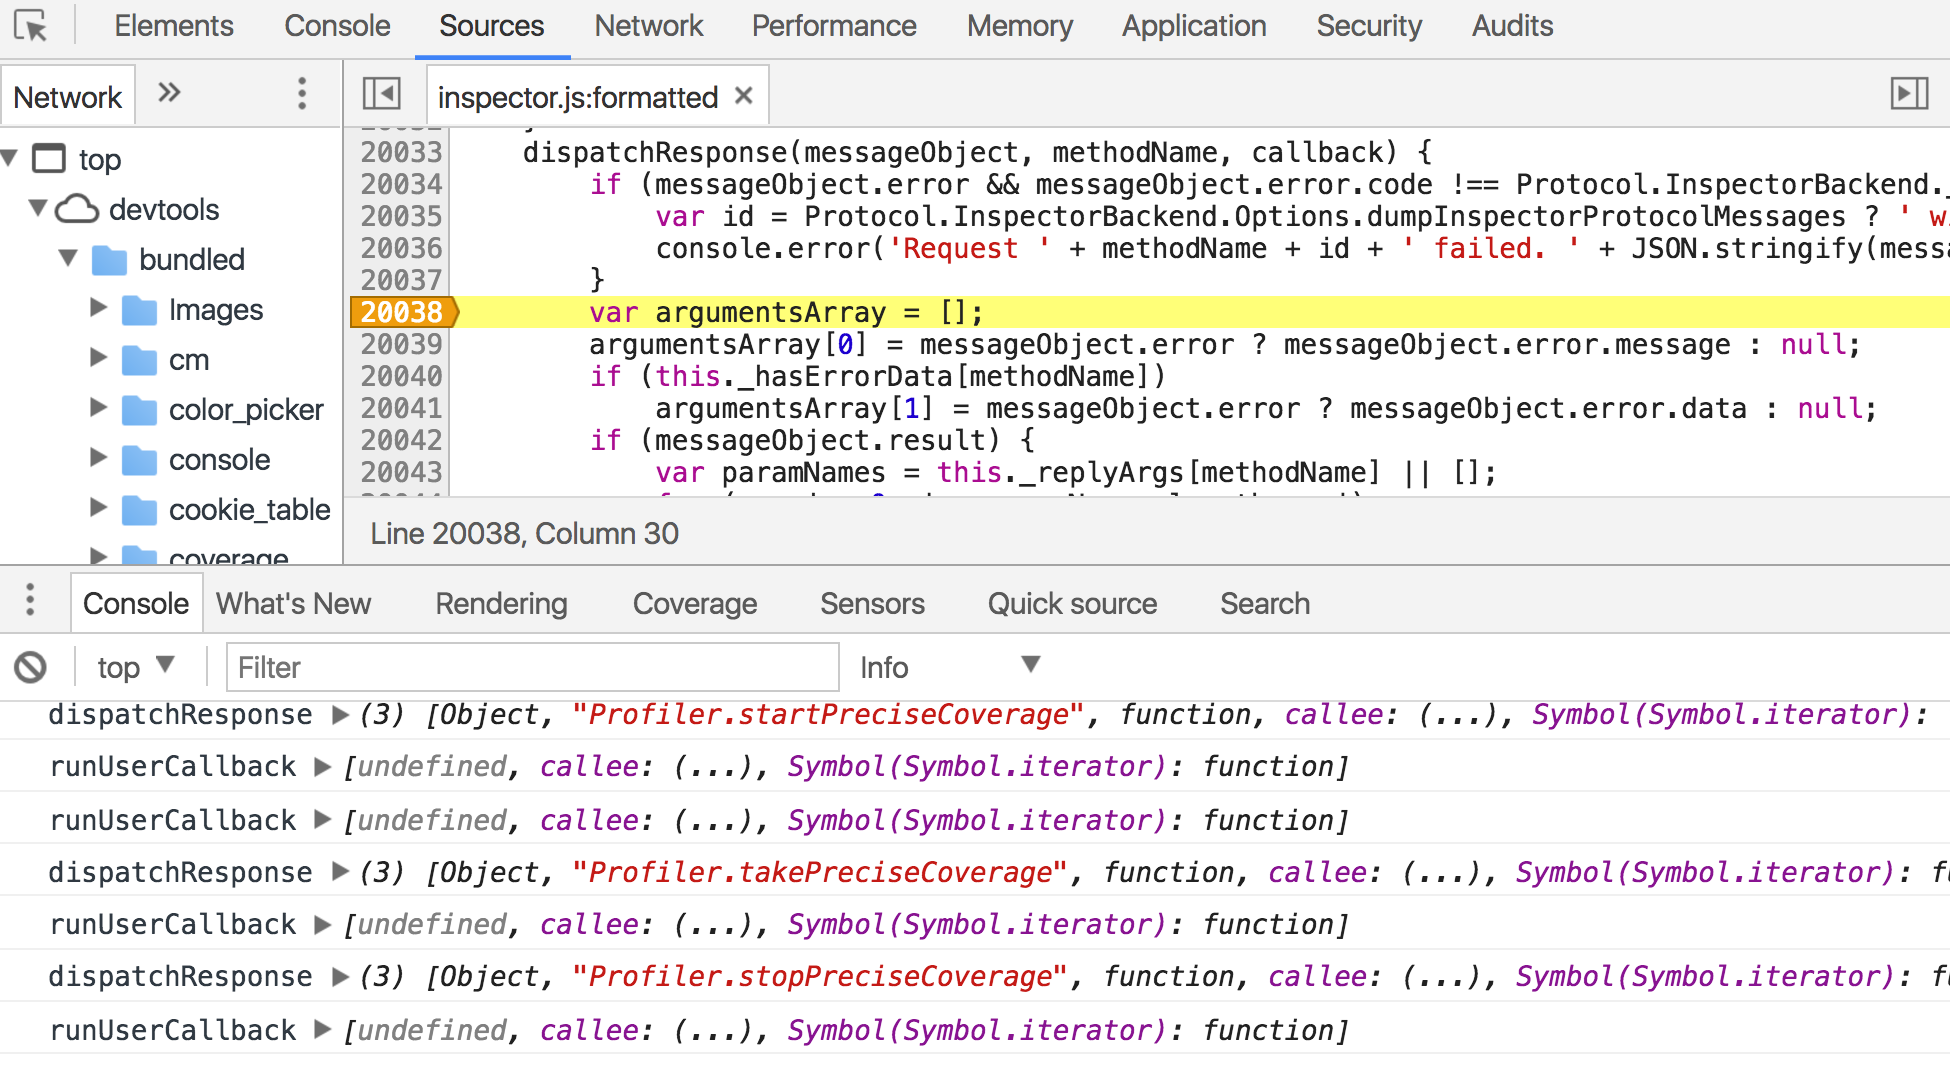
This is the an excerpt from the data that gets sent to Chrome DevTools:
result": [{
  "scriptId": "192",
  "url": "http://todomvc.com/examples/backbone/node_modules/jquery/dist/jquery.js",
  "functions": [{
      "functionName": "jQuery",
      "ranges": [{
          "startOffset": 1797,
          "endOffset": 2036,
          "count": 1
      }]
  }, {
      "functionName": "pushStack",
      "ranges": [{
          "startOffset": 3109,
          "endOffset": 3399,
          "count": 1
      }]
  },
As you can see it lists ranges of code and says how often they’ve been executed.
But I said there are two ways to get this info. The other way is to find the tests for the coverage module in V8 and look at the expected result:
result : [
  [0] : {
      functions : [
          [0] : {
              functionName :
              ranges : [
                  [0] : {
                      count : 1
                      endOffset : 119
                      startOffset : 0
                  }
              ]
          }
          [1] : {
              functionName : fib
              ranges : [
                  [0] : {
                      count : 15
                      endOffset : 73
                      startOffset : 1
                  }
              ]
          }
Finding the code inside V8
We now have a decent idea of what the API that V8 provides looks like. Next we’ll take a look at the actual API implementation.
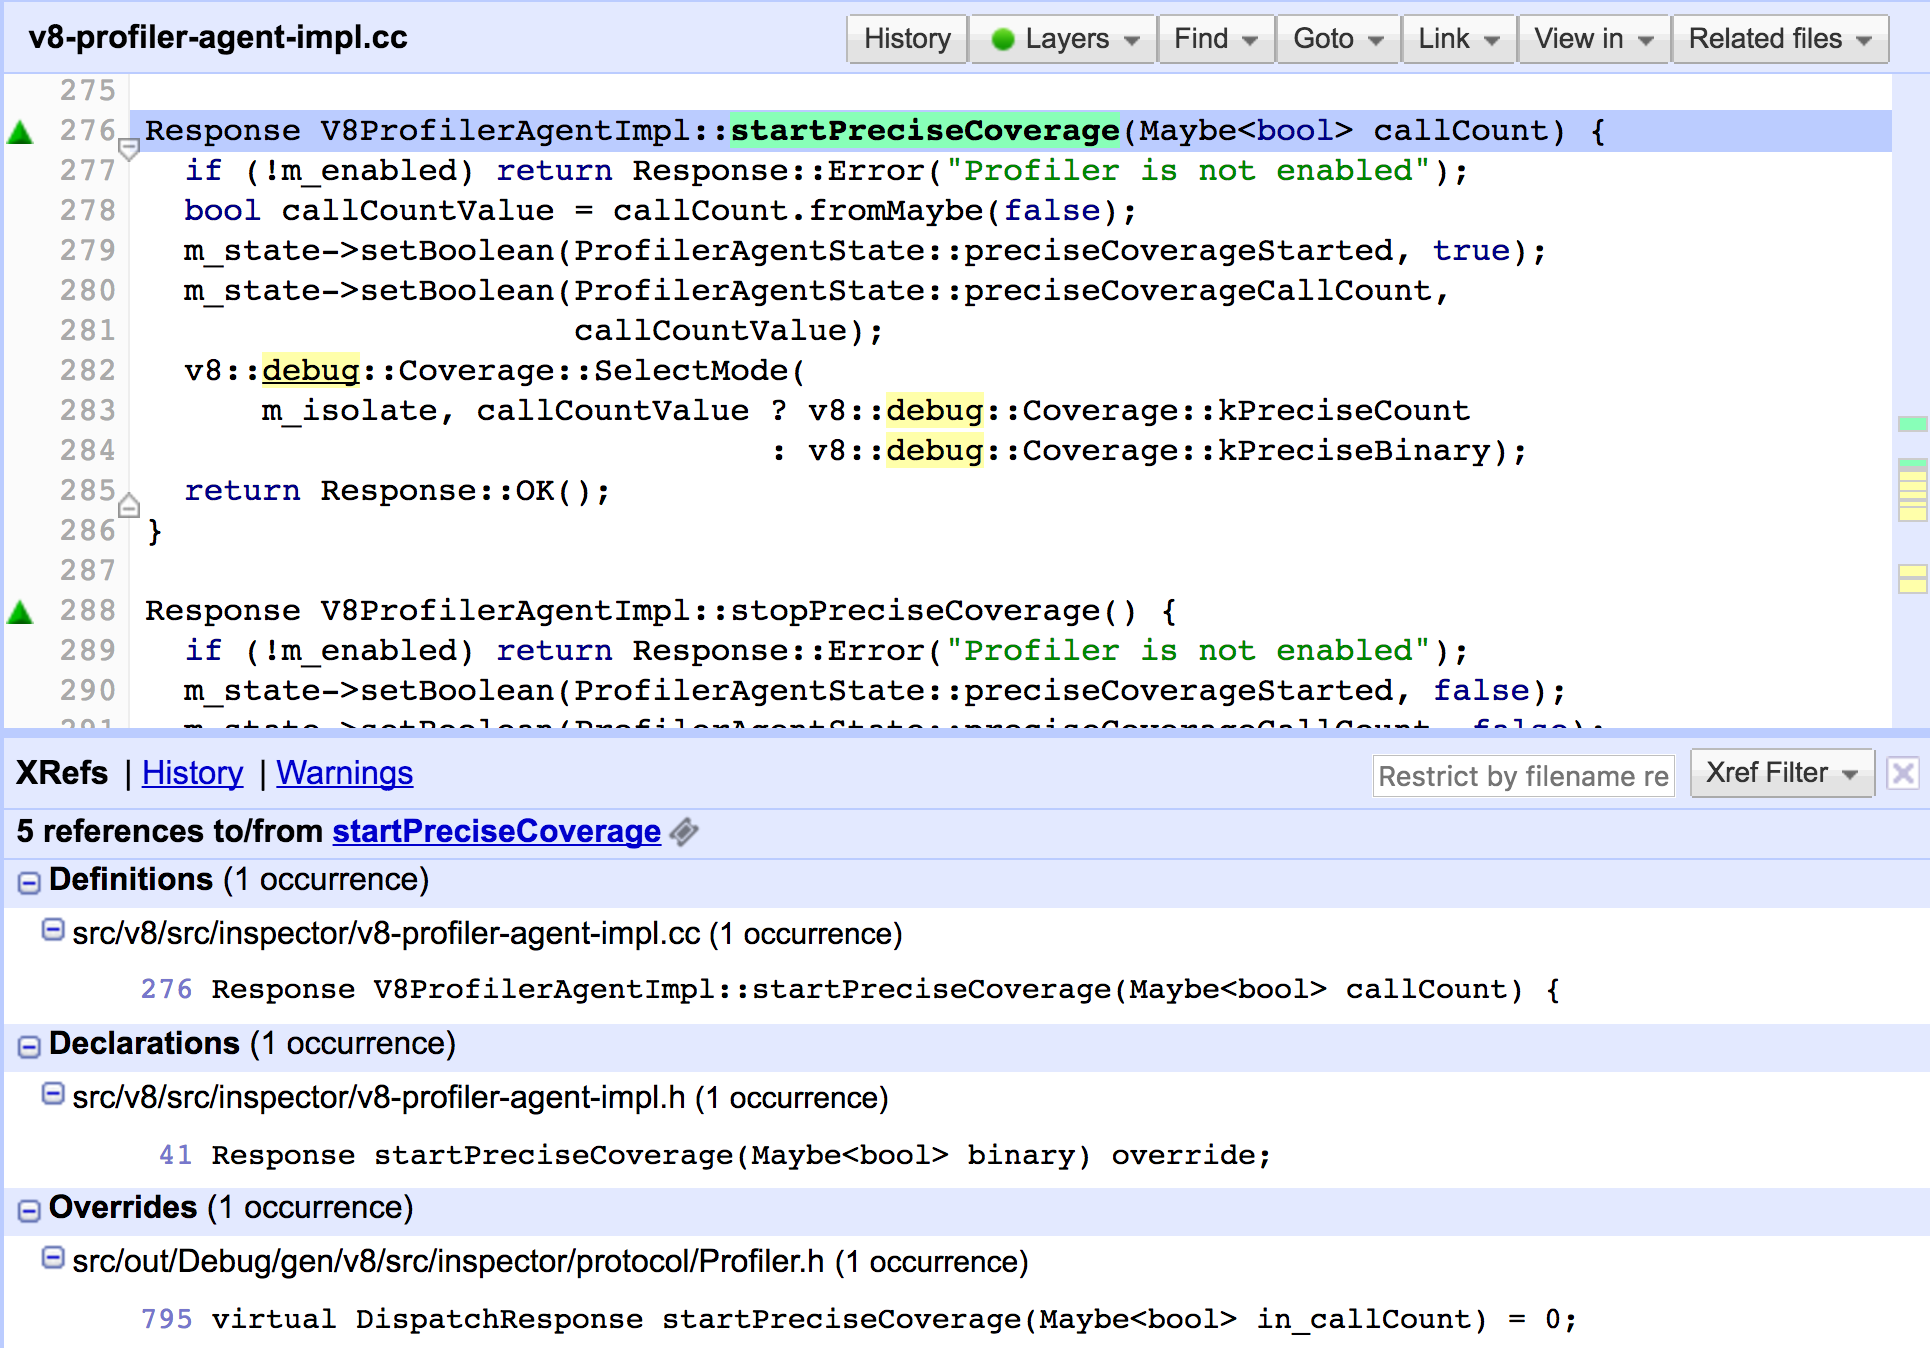
By searching for startPreciseCoverage we can find the relevant C++ code.
Response V8ProfilerAgentImpl::startPreciseCoverage(Maybe<bool> callCount) {
  if (!m_enabled) return Response::Error("Profiler is not enabled");
  bool callCountValue = callCount.fromMaybe(false);
  m_state->setBoolean(ProfilerAgentState::preciseCoverageStarted, true);
  m_state->setBoolean(ProfilerAgentState::preciseCoverageCallCount,
                      callCountValue);
  v8::debug::Coverage::SelectMode(
      m_isolate, callCountValue ? v8::debug::Coverage::kPreciseCount
                                : v8::debug::Coverage::kPreciseBinary);
  return Response::OK();
}
I don’t really understand this. But what matters is that we can click on some of the types in Chrome code search and find more code.
For example, if you click on kPreciseCount we’ll find this:
enum Mode {
  // Make use of existing information in feedback vectors on the heap.
  // Only return a yes/no result. Optimization and GC are not affected.
  // Collecting best effort coverage does not reset counters.
  kBestEffort,
  // Disable optimization and prevent feedback vectors from being garbage
  // collected in order to preserve precise invocation counts. Collecting
  // precise count coverage resets counters to get incremental updates.
  kPreciseCount,
  // We are only interested in a yes/no result for the function. Optimization
  // and GC can be allowed once a function has been invoked. Collecting
  // precise binary coverage resets counters for incremental updates.
  kPreciseBinary
}
Even if you don’t know the language you can always read the comments!
Looking back at the startPreciseCoverage method we can see that kPreciseCount is used if callCount is passed in, otherwise kPreciseBinary.
callCountValue ? v8::debug::Coverage::kPreciseCount
                  : v8::debug::Coverage::kPreciseBinary
By clicking through the Chrome Code search UI you can discover more. I’ll highlight some of the things I found interesting below.
How precise is the coverage tracking
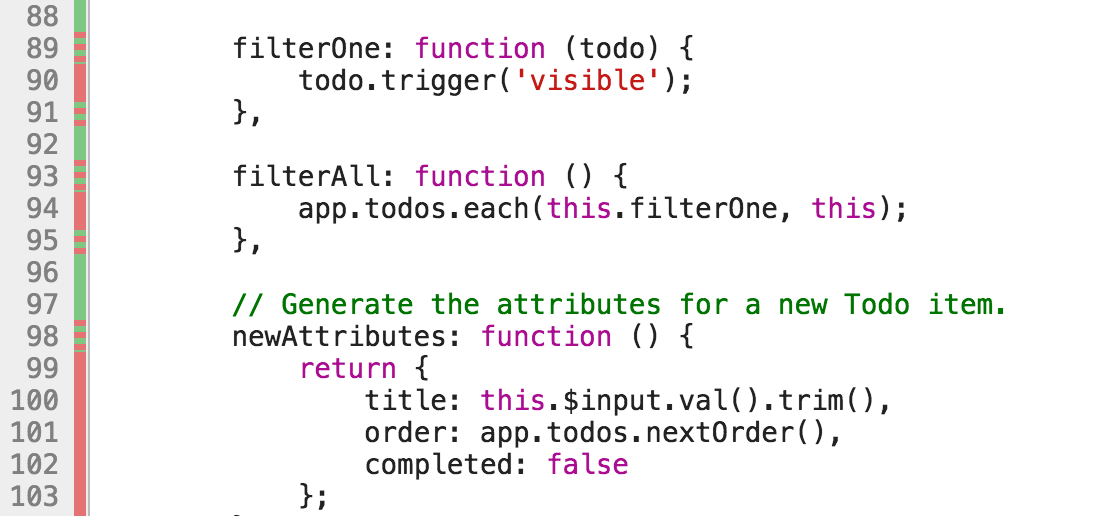
One of the things I was curious about was how it knows exactly what code range has run. It turns out that tracking isn’t actually that exact and it happens at the function level.
// At this point we only have per-function coverage data, so there is
// only one range per function.
Where is the number of invocations stored?
Functions have a FeedbackVector which can store the number of invocations.
Where is the invocation count incremented?
Here. The name Generate_InterpreterEntryTrampoline suggests it’s to do with V8’s new Ignition interpreter. But the code also appears to depend on the platform (there are different implementations for Generate_InterpreterEntryTrampoline).
Anyway, I doesn’t matter all that much. This is the code that matters:
__ SmiAddConstant(
      FieldOperand(rcx, FeedbackVector::kInvocationCountIndex * kPointerSize +
                            FeedbackVector::kHeaderSize),
      Smi::FromInt(1));
We add 1 to the invocation count.
FieldOperand points to the address of the invocation count in memory. rcx at this time points to the location of the feedback vector in memory. Then V8 does some calculations to find out where the invocation count is in relation to the feedback vector object.
A Smi is a small integer. It’s a pretty ordinary integer, except V8 uses one bit to remind itself that this value isn’t a pointer.
Optimization
When enabling coverage all optimizations are disabled:
// Remove all optimized function. Optimized and inlined functions do not
// increment invocation count.
Deoptimizer::DeoptimizeAll(isolate);
Future inlining is disabled - I don’t know exactly inlining means in this context.
bool SharedFunctionInfo::IsInlineable() {
  // Check that the function has a script associated with it.
  if (!script()->IsScript()) return false;
  if (GetIsolate()->is_precise_binary_code_coverage() &&
      !has_reported_binary_coverage()) {
    // We may miss invocations if this function is inlined.
    return false;
  }
  return !optimization_disabled();
}
However, if we only care whether or not a function has been called - rather than the exact invation count - V8 does enable inlining once the invocation has been reported.
Pretty cool, right?
The coverage report works on a per function level by incrementing a counter when a function is called.
And Chrome code search is a truly helpful tool to figure out what’s going on!
