You can get a simple Node REPL by just running the node command by itself.
node
> fs = require('fs')
...
> fs.readFileSync('./test.txt').toString()
"Hello world!""
But what if your code isn’t working and you don’t know why? We need a debuggable Node REPL.
Luckily, assuming your run Node version 7+, that’s pretty easy.
First, run the following command to start a new Node process. The -e flag lets us pass in some
JavaScript code to evaluate, instead of passing a file name. Here all we want to do
is set a long timeout so that the Node process doesn’t exit.
node --inspect -e "setTimeout(function(){}, 1000000000)"
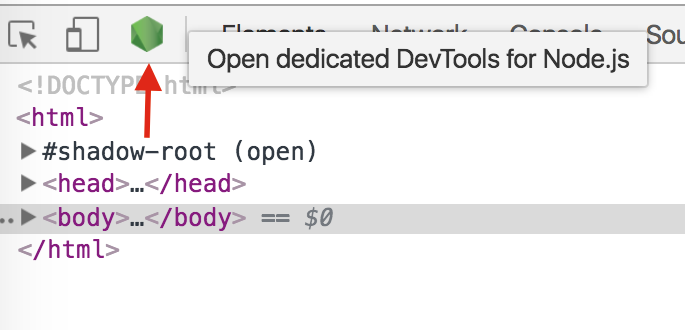
Then open DevTools in Chrome and press the green button in the top left:
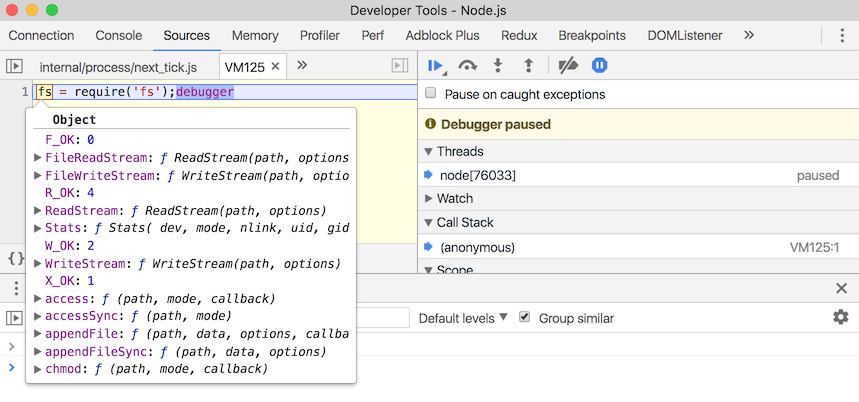
You can now use the DevTools console with full debugger support! Let’s try running this:
fs = require('fs');debugger;fs.readFileSync('./test.txt').toString()
Node will pause at the debugger statement, and we can for example step into the readFileSync call: