I spent £589.79 ($761.27) hosting DebugBear on Google Cloud Platform in October. But what am I actually paying for?
There are lots of little costs I didn’t consider when starting out. It’s often difficult to figure out when and why a given amount of resources was used. In this post I try to understand and break down my bill.
Summary
- Expect to discover unexpected costs, for example for outgoing traffic or server logs
- Free tiers can conceal increased resource usage, and rather than costs rising slowly you’ll suddenly go from paying nothing to paying significant amounts
- Resource costs per unit vary throughout the month due to free tiers and sustained use discounts
- Use Stackdriver metrics and the BigQuery billing export to understand and break down your costs
My billing dashboard uses GBP, so that’s what I’ll use most of the time in this post. USD would make some numbers a bit easier, for example an SKU might cost $0.17 per GB instead of £0.132021999.
A high-level breakdown by Google Cloud product
This chart shows the breakdown by product:
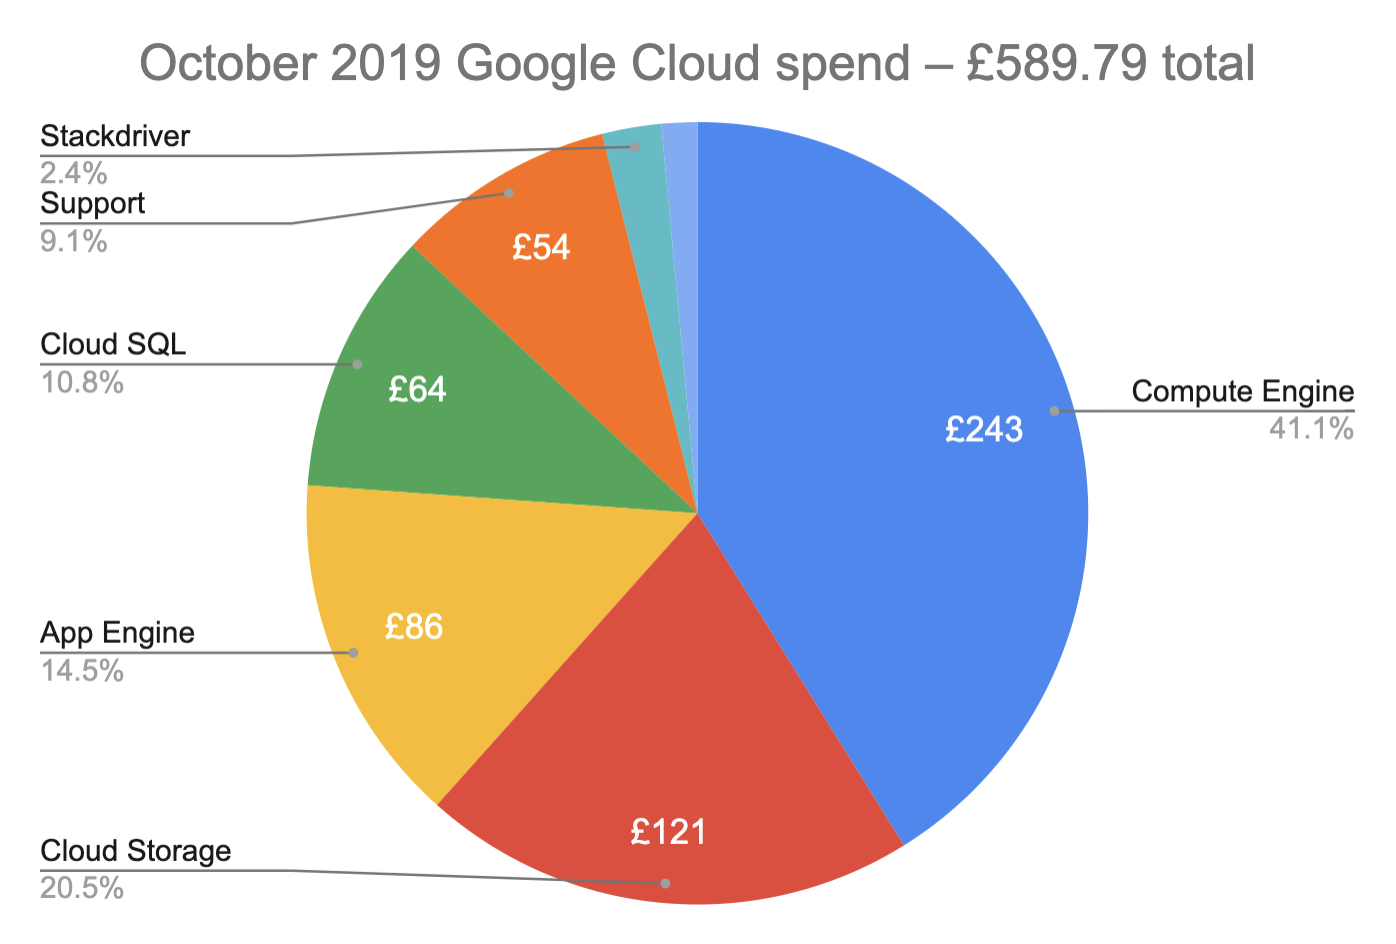
Here’s some more info on what each product is used for:
| Service | What it’s used for | Cost |
|---|---|---|
| Compute Engine | Perform the core service of monitoring customer websites | £242.61 |
| Cloud Storage | Mostly Docker image hosting for Compute Engine | £120.74 |
| App Engine | Hosting the user-facing website | £85.73 |
| Cloud SQL | Hosting the database | £63.91 |
| Support | Technical support for Google Cloud | £53.64 |
| Stackdriver | Logs and monitoring | £14.44 |
| Cloud Functions | Scheduling logic | £8.72 |
I’ll break down each the costs for each product by individual billed resource (SKU) and try to explain the amount of resource usage and the billed amount.
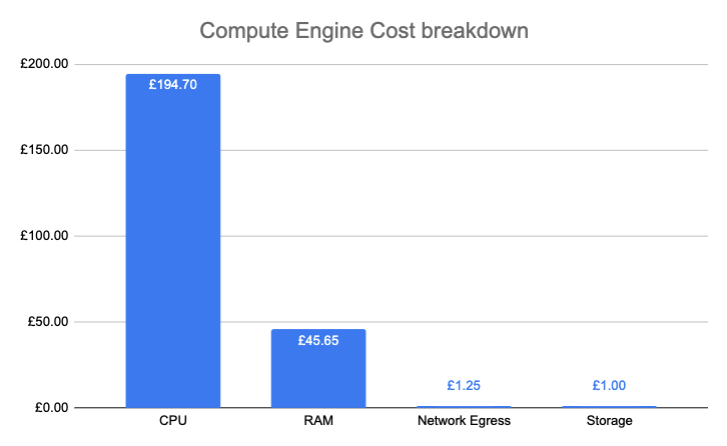
Compute Engine costs
The costs here are all pretty expected, most of it paying for the actual server instances I’m using.
My VMs use a custom machine type instead of the predefined ones like n1-standard-2, so I’m billed for the number of hours of “Custom Instance Core” and “Custom Instance Ram” used. These are charged in 1 second increments.
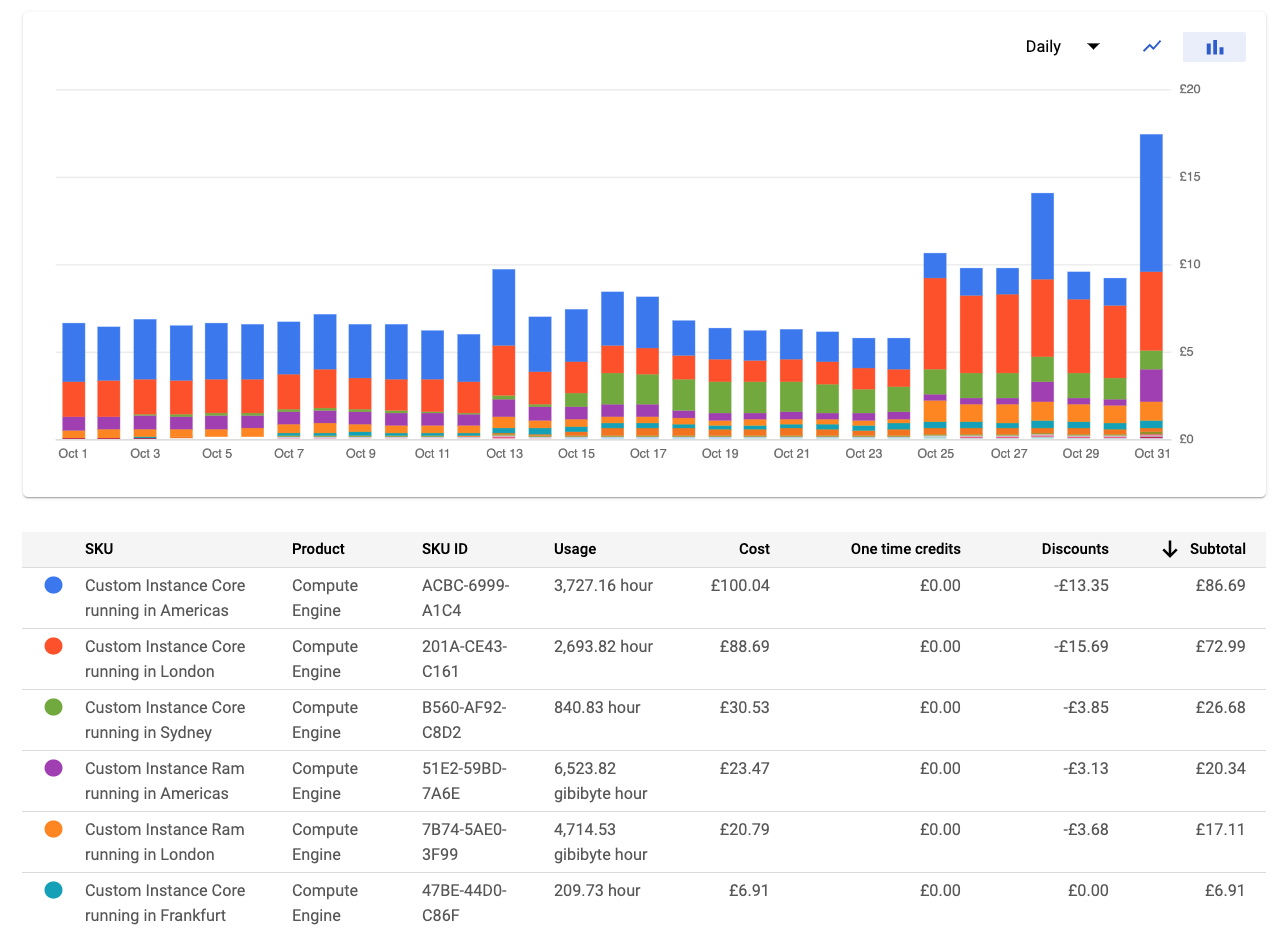
You can see that I onboarded a new UK based customer on the 25th of October. There are also occasional spikes in US usage for one-off projects.
Sustained Use Discounts
The main complexity for Compute Engine billing comes from Sustained Use Discounts.
If you run an n1-standard-2 VM for a week it will cost you $2.28 per day. But if you run it for a whole month you’ll pay only pay $1.61 per day on average. Towards the end of the month you’re only paying $0.91 for each additional day.
The maximum discount you can reach is 30%. If you use a resource for less than 25% of the month you’ll get no discount.
The discount is applied for using a consistent amount of resources, not identical ones. If you shut down one VM and then create a new one this will be billed the same as if you had kept using the first VM.
For me, the usage pattern for how many cores I use looks something like this. (I took the screenshot from the GCE VM Instance metric in Stackdriver.)
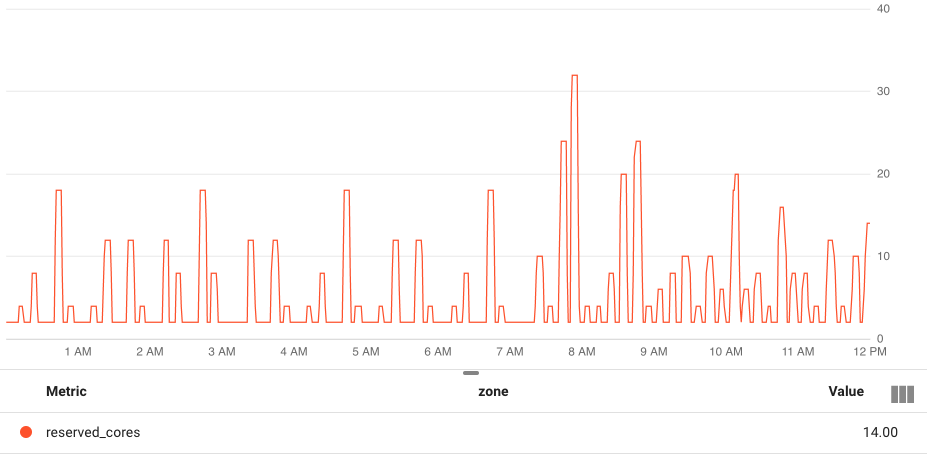
Rather than using a consistent number of CPUs the usage pattern is dominated by occasional spikes with a large number of CPUs. Because of that no sustained use discount is applied.
However, I also keep one machine with two CPUs running continuously, and I receive a 30% discount on that usage.
That machine alone uses 1488 CPU hours (2 CPUS for 24h a day for 31 days). So just due to this machine I’d expect a discount of 1488 / 3727 * 30% = 12%, 3727h being the total monthly resource consumption. The actual discount that’s applied is 13.3%, so we can tell that at least 25% of the time more than 2 CPUs are in use.
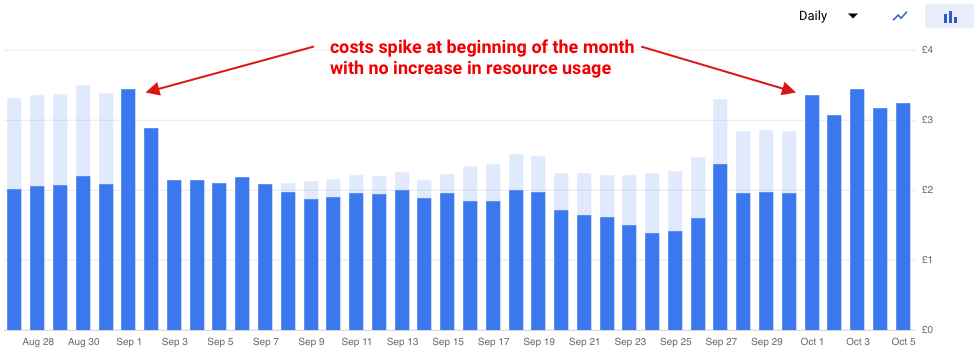
When overlaying the discounted cost over the original undiscounted cost you can see that the discounts start being applied towards the end of the month.
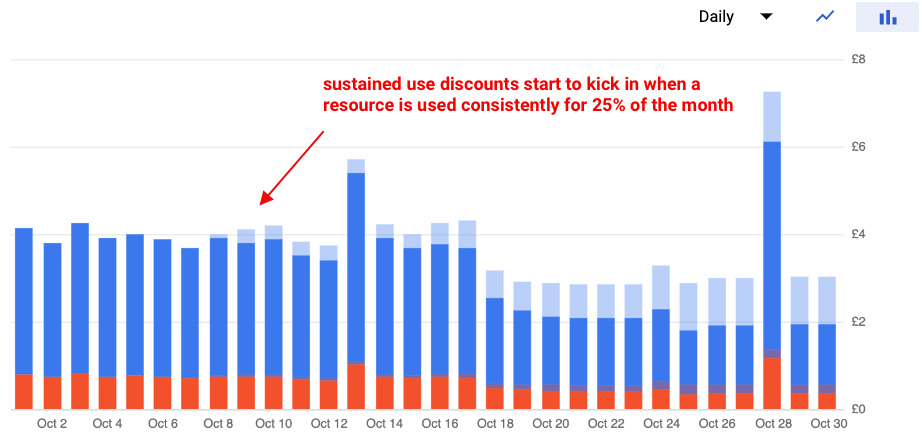
This means you can generally expect your post-discount Cloud Storage costs to jump up at the beginning of the month.
Storage capacity
I also paid £0.93 for the disks used by the virtual machines.
For example, I used 16.57 gibibyte month of disk storage in London. This is billed at £0.039 per Gigabyte month, and on average I was running 1.8 virtual machines with 10GB of disk space each. So the total cost is 1.8 * 10 * £0.039 ≈ £0.70.
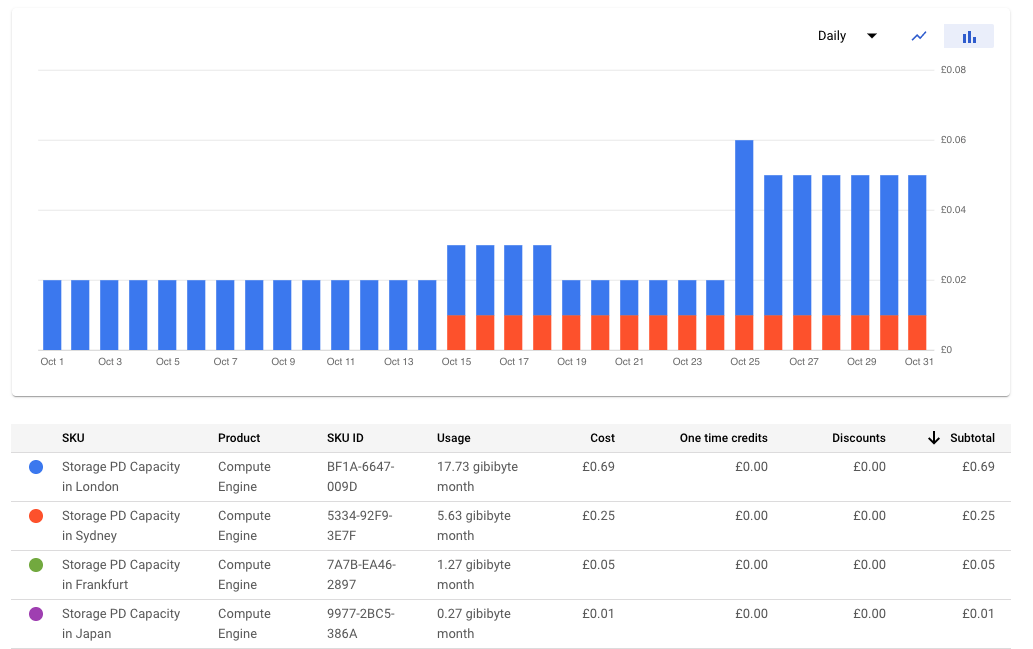
You might notice that I’m not paying anything for servers in the US. That’s because there’s a 30GB free tier that applies to some regions. Without that free tier I’d have to pay another £0.68.
Network Egress
I paid another £1.27 for outgoing traffic from my VMs. This can be broken down into different types of network egress. Some of these have free tiers, others don’t.
- general traffic to other servers on the internet
- traffic to other Google Cloud servers
- within the same zone (this is free)
- within the same region
- within the same continent
- intercontinental egress
- traffic to other Google services (this is free)
- Carrier Peering – I was billed 4 pence for this, but I don’t understand what it means in my case
Most of my costs were for general Internet Egress. By volume, most of the traffic was within my primary Google Cloud region.
SKU breakdown
Luckily the predictable server costs far outweigh the hard-to-control costs for outgoing network traffic:
Cloud Storage costs
This was a big problem for me at the beginning of the month. I already wrote about this before.
In short, every time I launched a VM in the UK it downloaded the Docker image from the US and I was charged for Cloud Storage Egress between the two regions. Eventually I fixed it by hosting the Docker image in Europe.
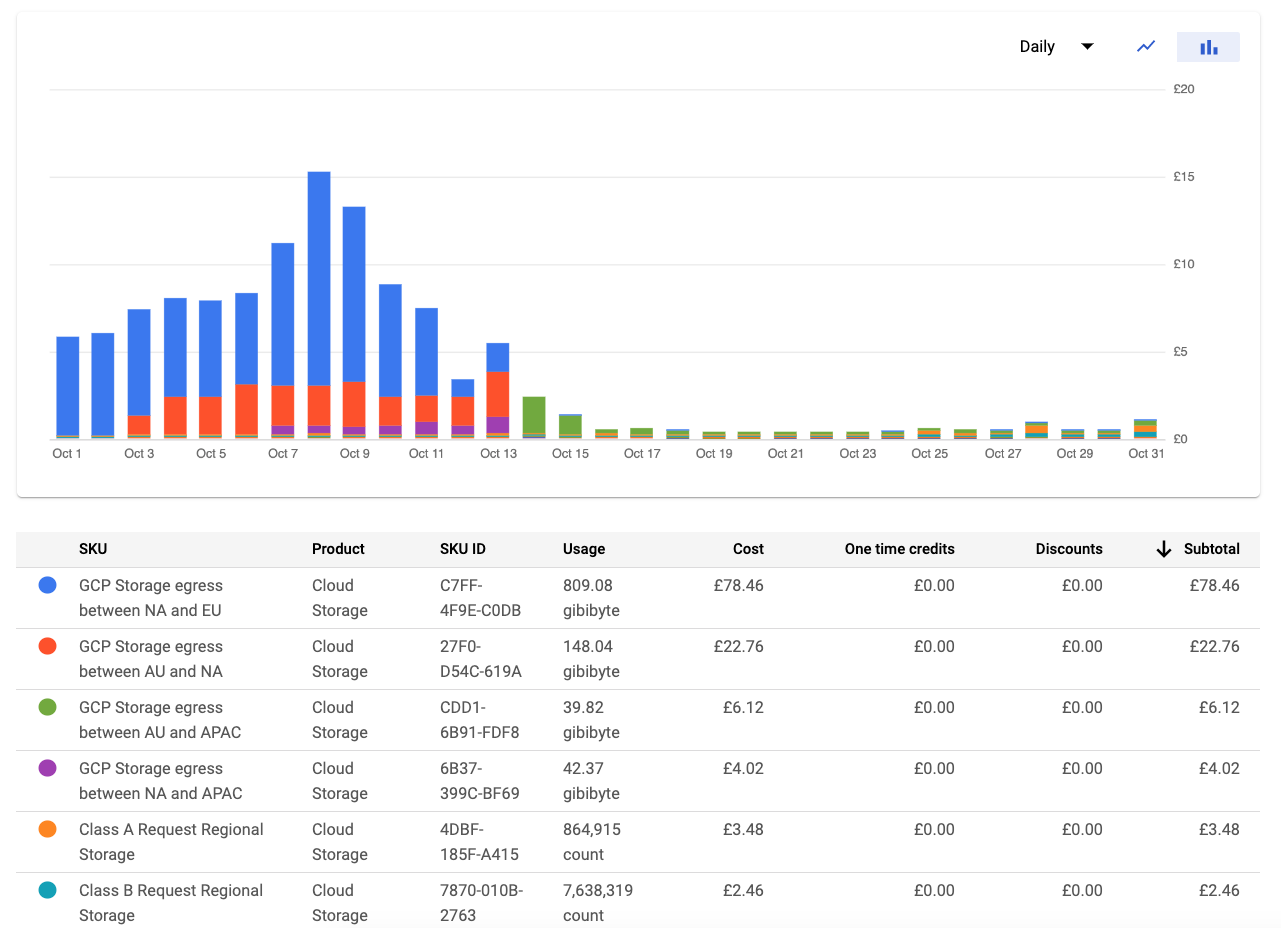
Those egress costs were causing the biggest chunk of my bill.
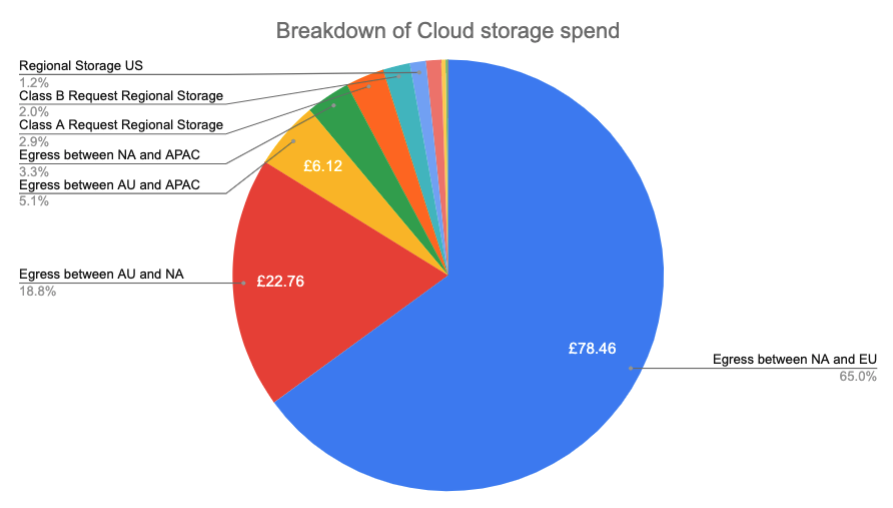
Since the large egress costs were a short-term problem, let’s just look at the second half of the month.
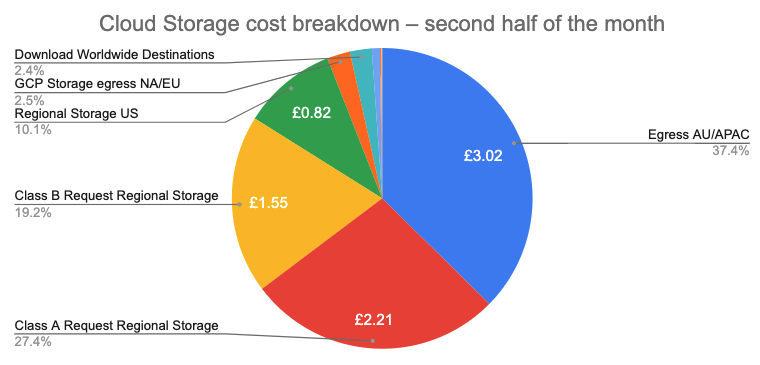
Egress AU/APAC
Cloud Storage traffic going to Australia is still a big factor. That’s because the Google Container Registry doesn’t have a location there and I still download the Docker image from the US every time I launch a new VM.
Class A and Class B operations
Class A operations are things like inserting an item into a bucket. They are about 10 times more expensive than Class B operations, such as retrieving an item from the bucket.
Class A and B operations have a free quota of 5,000 and 50,000 operations, respectively. But that free quota was already used up in the first half of the month, so I won’t include it here.
| Operation Type | Number of operations made | Cost per 1M | Cost |
|---|---|---|---|
| Class A | 546,677 | £4.046 | £2.21 |
| Class B | 4,781,317 | £0.311 | £1.55 |
Storage
On average I was using 94.85 GB of cloud storage last month. The first 5 GB are free, each additional GB costs £0.0162, giving a total cost of (94.85 - 5) * £0.0162 = £1.45.
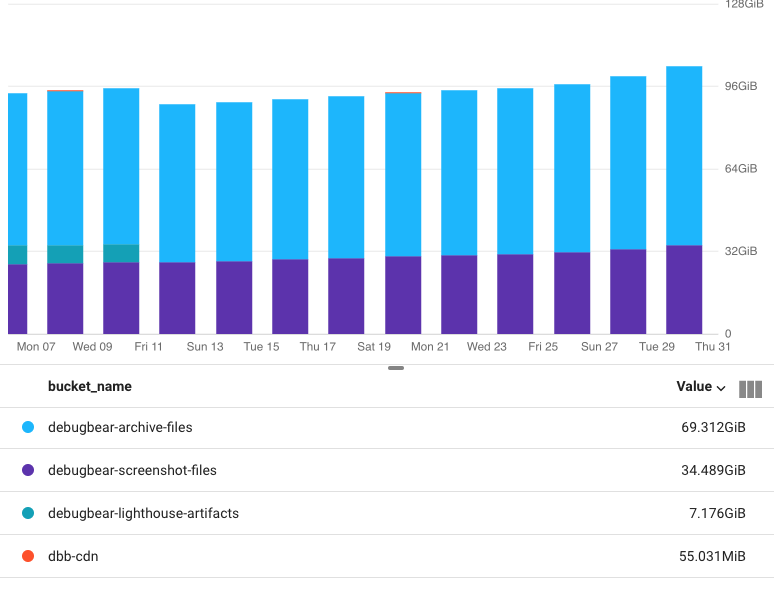
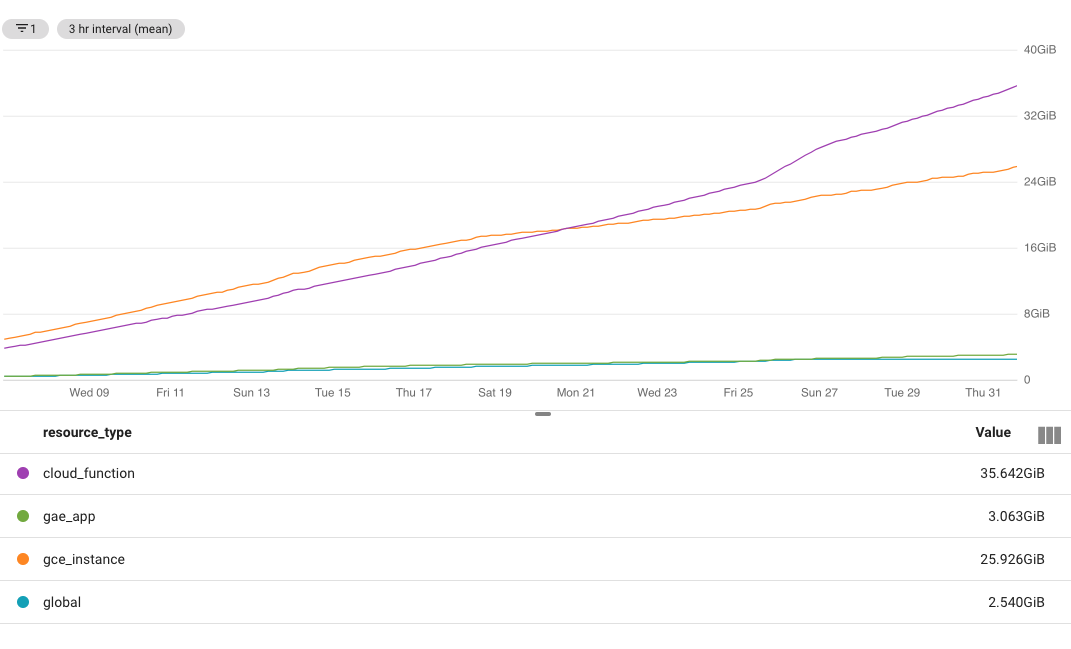
You can get a breakdown of storage usage by using the Stackdriver metric explorer and selecting “GCS Bucket -> Total bytes”. That data there is deleted after a while, so this chart only shows bucket size from October 7 onwards.
App Engine costs
This is for hosting the user-facing website. It’s billed by the front-end instance hour. The F2 instance type I’m using uses 2 instance hours per hour on the clock.
Since I paid for 2985 instance hours that means on average 2985 / 2 / 31 / 24 = 2.0 instances were active at the same time.
Unlike most other services, App Engine has a daily free quota of 28 instance hours. So while I used 2985 instance hours I only paid for 2985 - 28 * 31 = 2117.
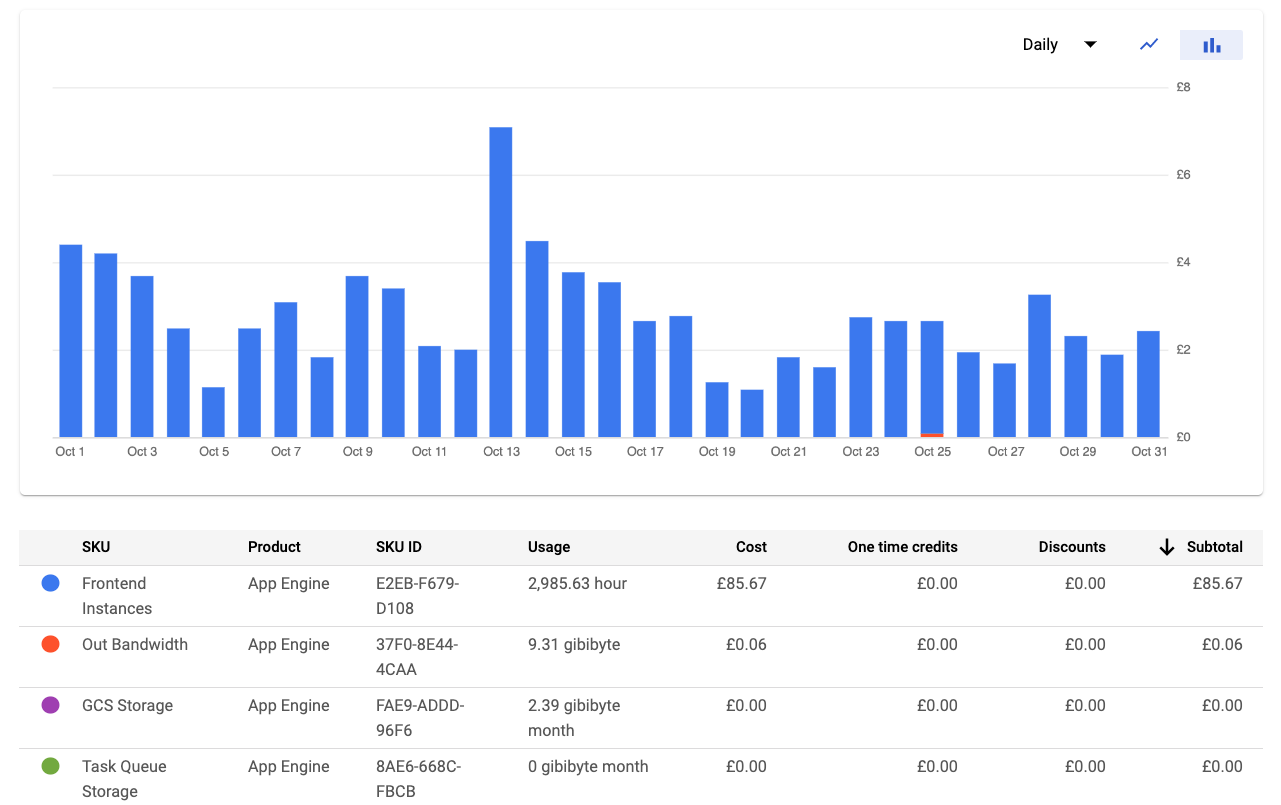
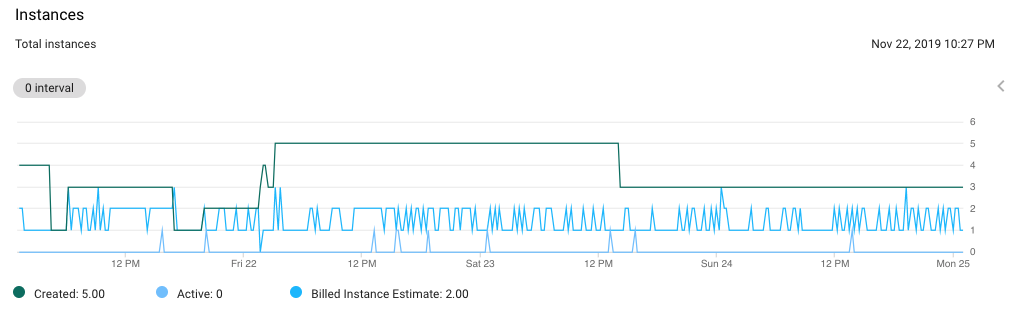
Since I use automatic scaling, App Engine costs are pretty hard to predict overall. Sometimes GCP doesn’t shut down instances that no longer serve any traffic, and not all instances are always billed for.
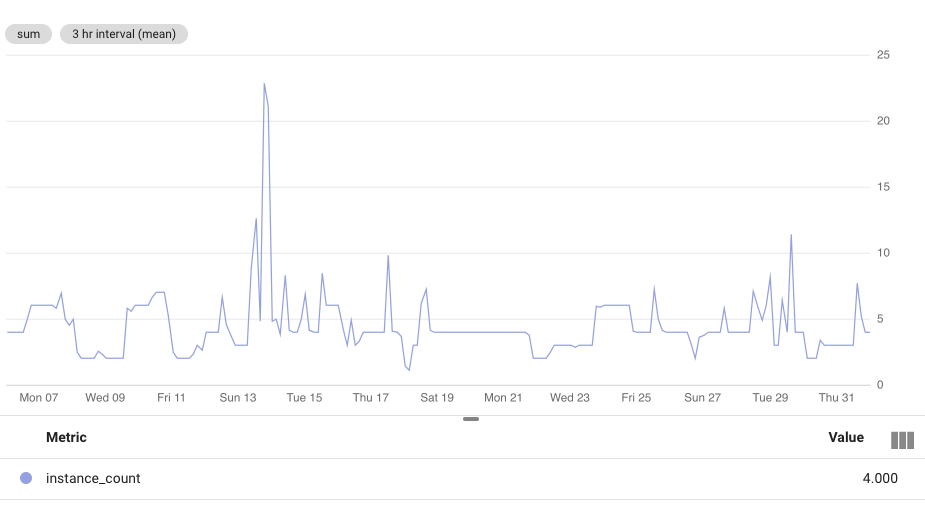
This Stack driver chart puts the average number of active instances at around 4.
But the “Billed Instance Estimate” from the App Engine dashboard tends to be lower:
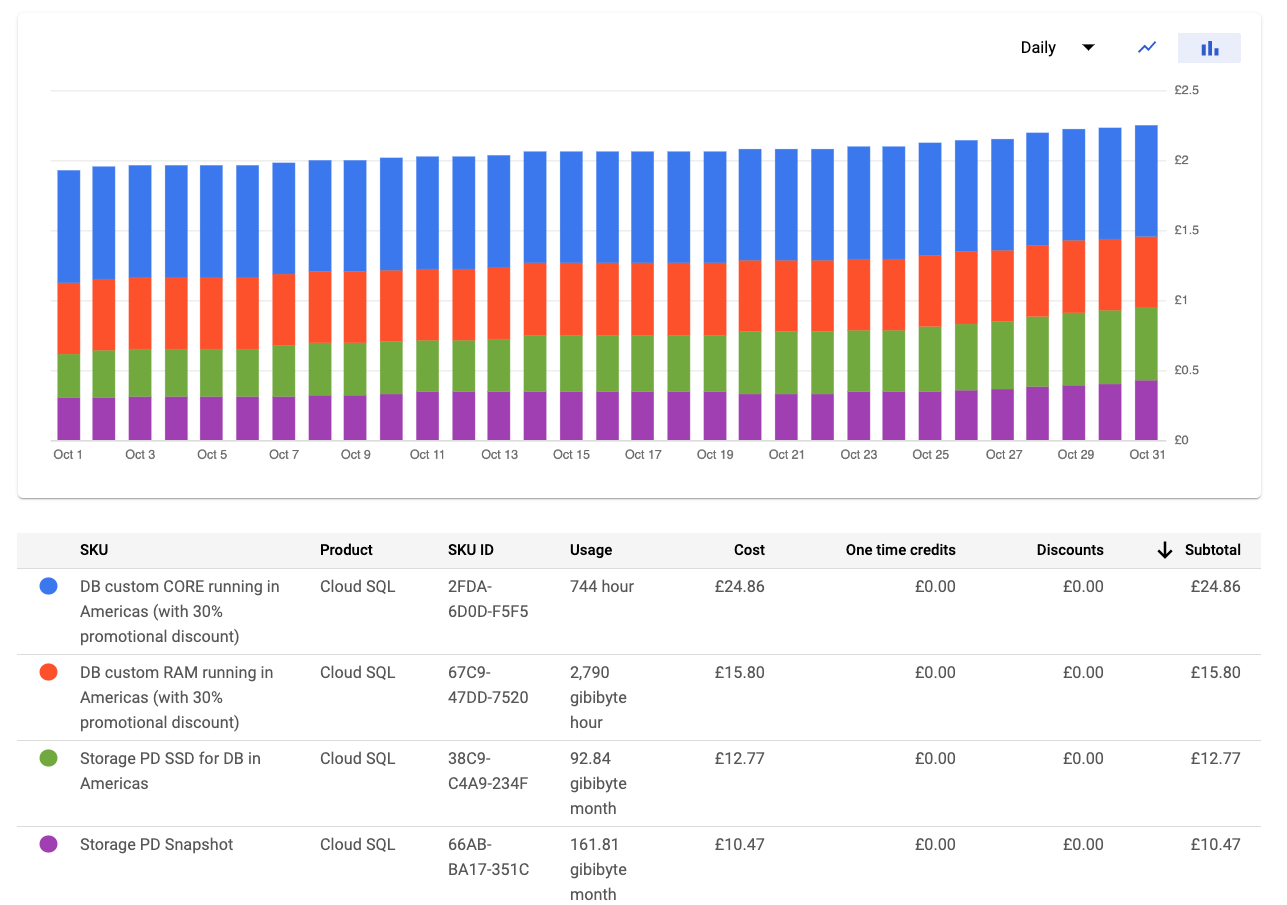
Cloud SQL costs
The database costs consist of three different components:
- Running the server (CPU/memory)
- Storing database contents
- Storing backups
Network egress is free within a Google Cloud Platform region (Network Google Egress from Americas to Americas), so the 213.94GB of data served from the database didn’t come at an additional cost.
However, accessing the database from my local machine will incur costs for “Network Internet Egress from Americas to EMEA”. This was only 30MB though, so I didn’t pay anything.
CPU and memory costs
These costs are fairly constant and predictable, since there’s only one database server running at any given time. So usage will be 31 * 24h = 744h.
At once CPU and 3.75GB RAM that’s £0.77 a day for CPU and £0.48 a day for memory.
You may notice that the SKU is called DB custom CORE running in Americas (with 30% promotional discount). That’s the equivalent of the maximum 30% sustained use discount.
Storage costs
Storage costs increase throughout the month as the amount of data stored increases. Cloud SQL automatically increases the disk size when necessary.
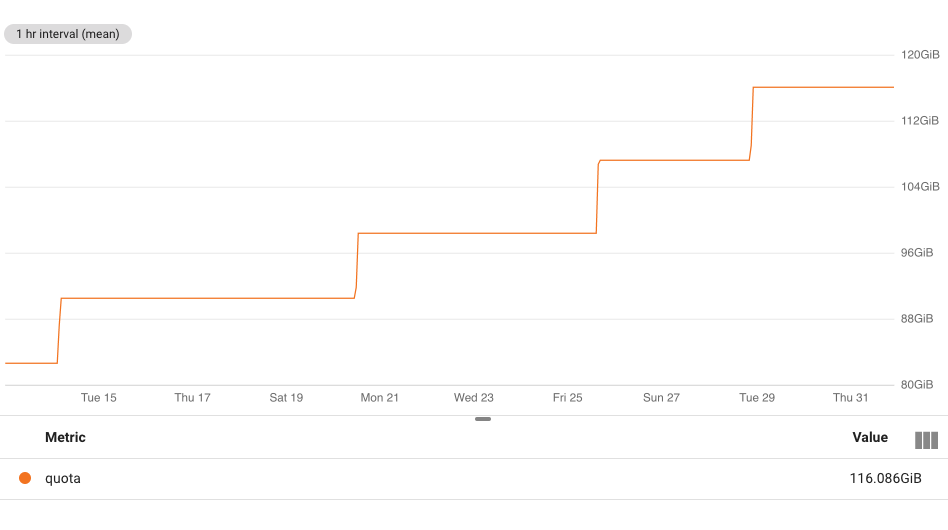
(I took this screenshot pretty late, so data from before October 14 was no longer available.)
Average disk size was 92.84GB, so disk costs are roughly £0.13 * 92.84 = £12.26.
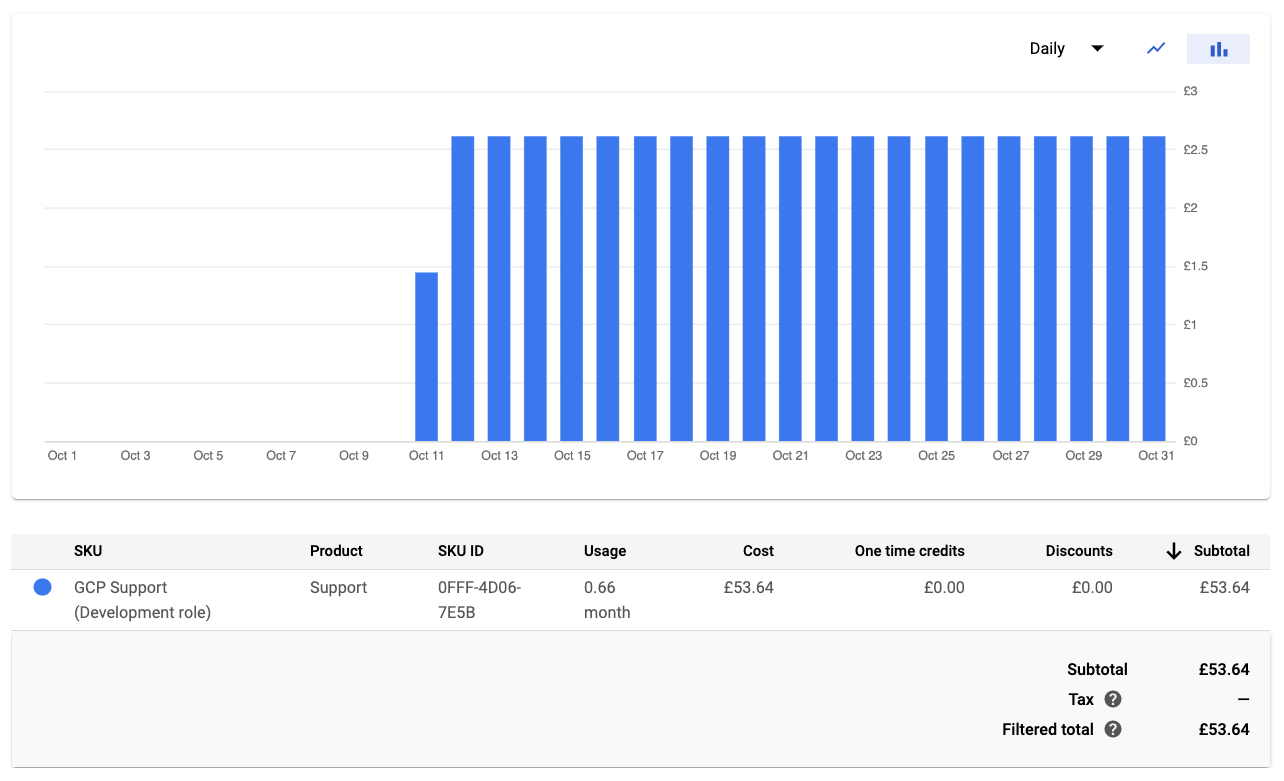
Support costs
Google does not provide technical support unless you pay extra for it, starting from $100 per user per month.
There is free support for billing issues, but if there’s a technical aspect like trying to find a breakdown for a particular SKU or explaining what an SKU includes they won’t be able to help you.
Since I kept running into various issues I decided to just start paying for support, to avoid having to figure out everything by myself.
Stackdriver costs
This is a great example of a cost that initially falls under the radar because of the free tier. Then as soon as you exceed the free tier you’ll notice a sharp increase in cost.
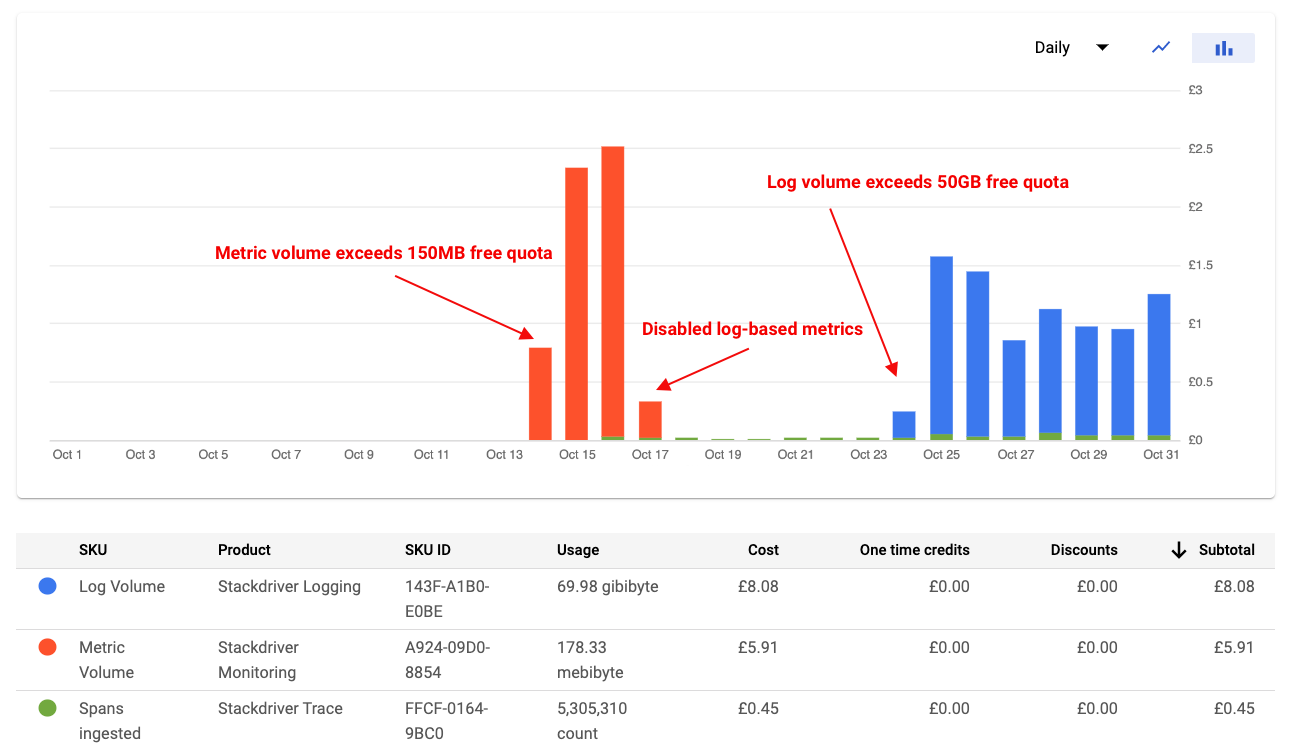
Monitoring
The first free tier I exceeded was for 150MB of Stackdriver Monitoring metrics. I was generating log-based metrics to monitor my website and create dashboards based on that data.
But Stackdriver custom metrics are a pain to use, so I had already started using another service to monitor the system. Therefore I could just disable the log-based metrics when I went beyond the free tier.
Log bytes
Most of the Stackdriver cost ultimately came from simply storing logs. Once you go over the 50GB free tier it costs $0.50 per GB!
I tried to reduce the log volume when I noticed the problem, but with limited success.
Trace spans
Finally, I was charged £0.45 for Stackdriver trace spans. This is latency data that breaks down what part of a request is taking a long time.
The first 2.5 million spans are free, after that it’s $0.20 per million spans.
Cloud Function costs
Cloud Functions are another great example of the free tier making your costs look deceptively low at the beginning of the month. This chart shows at what point the free tier for each SKU is exceeded.
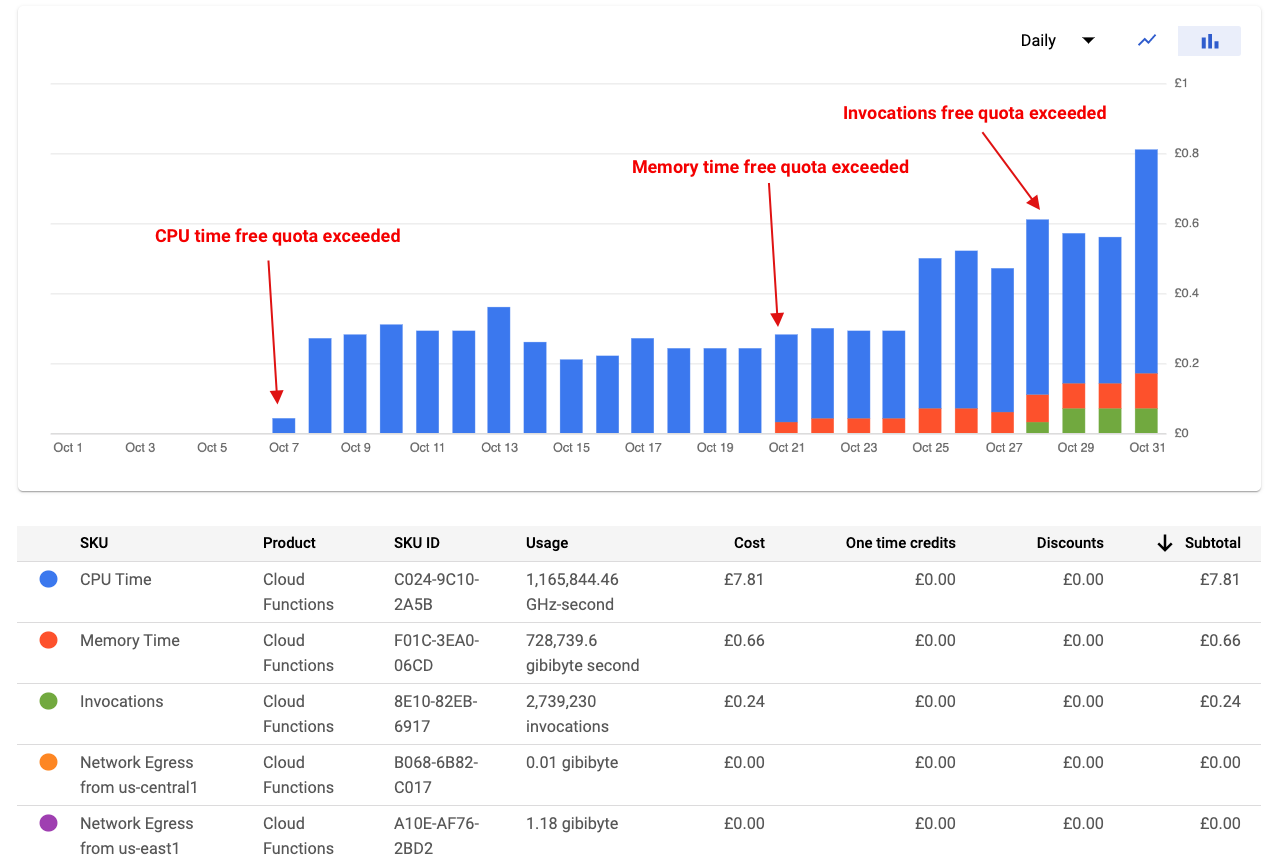
CPU and memory time
I’ve not been able to find a Stackdriver chart that shows the amount of CPU and memory time. But we can still take a look at the cost calculation.
All my functions use 512MB memory with an 800Mhz CPU allocation. On average it takes 0.5s to run a function, and there were 2.74M invocations in October.
CPU time is billed in Ghz-Seconds… so running one of my functions for 1s costs 0.8Ghz-Seconds. Each Ghz-Second costs £0.0000081. There’s a 200,000 Ghz-Second free tier.
So the expected cost would be: (2.74M * 0.5s * 0.8Ghz - 0.2M) * £0.0000081 = £7.26. That roughy matches the actual CPU time cost of 7.81. (The number is off because my average execution time estimate of 0.5s isn’t 100% right.)
Invocations
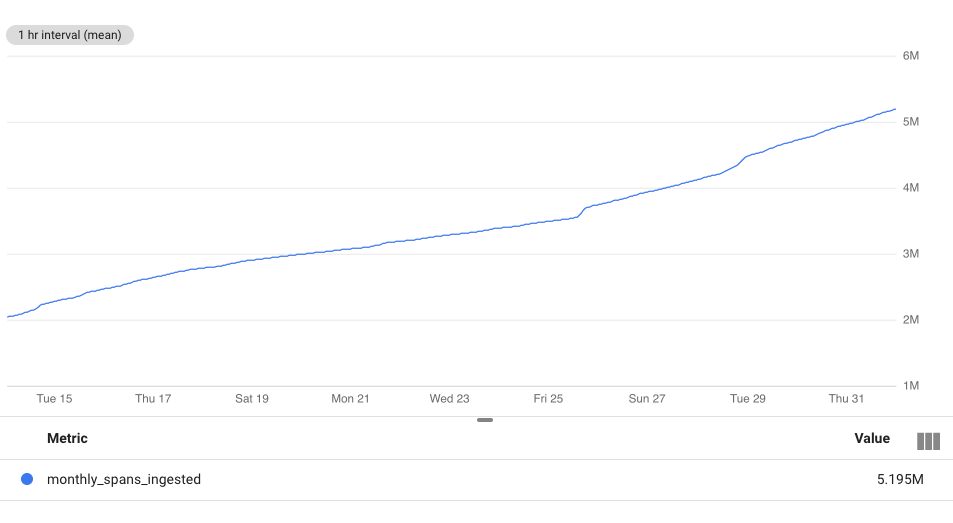
The Stackdriver chart below shows how many Cloud Function invocations were made over a 2 day period.
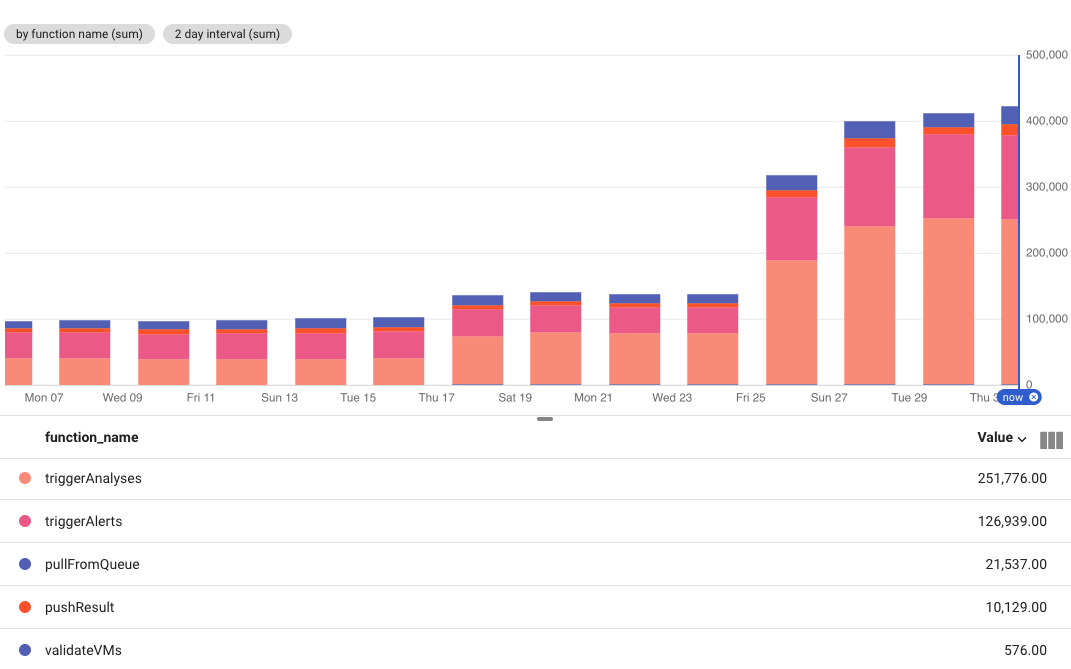
For the first 23 days this was around 60,000 per day, for the last 8 days of the month it was around 200,000 per day.
The first 2 million invocations are free, after that it costs $0.40 per million invocations. I used around 1.3M invocations in the first 23 day. Four days later I was at 2.1M invocations, and if you look at the chart from earlier you can see that’s where the billing starts.
Breaking costs down by function name
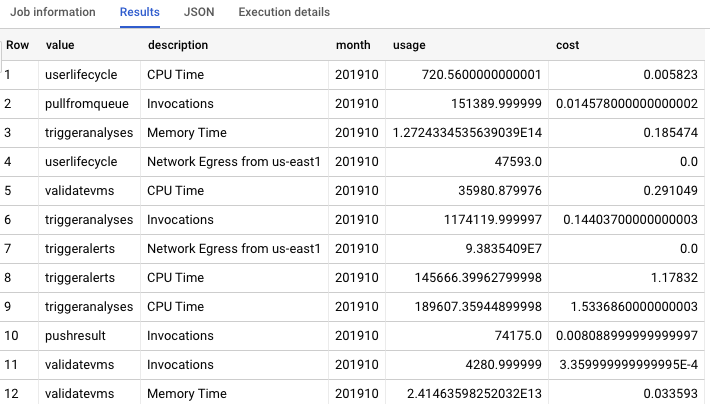
I’ve not found an easy way to do this, but it’s possible with resource labeling and exporting billing data to BigQuery.
Once you’ve set that up you’ll be able to see detailed billing data in BigTable. You can run a query like this to tally up the costs for each function.
SELECT
  labels.value,
  sku.description,
  invoice.month,
  sum(usage.amount) as usage,
  SUM(cost) as cost
FROM `debugbear-us.billing.gcp_billing_export_v1_01411E_BF0643_B26DD8`, UNNEST(labels) as labels
WHERE key = "cfname" AND invoice.month = "201910"
GROUP BY key, value, invoice.month, sku.description
You’ll get a result table like this:
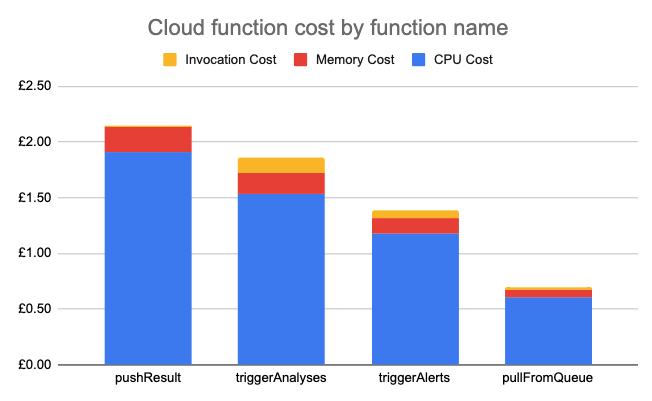
Then you can use that data to create a chart like this:
Conclusion
It’s not always easy to understand what exactly is going on. Use Stackdriver metrics to break down resource usage. If you can’t figure out what’s going on, try contacting technical support.
Google could make pricing more predictable and easier to understand by allowing customers to view their costs as if there was no free tier. It’s also often hard to figure out what an SKU really means, since there’s no direct link between the concepts described in the documentation and specific SKUs.
