Step by step debugging lets developers follow how their code is behaving as it is being run and understand why things aren’t working as they should. Google Chrome’s developer tools have different stepping features and breakpoint types that make step by step JavaScript debugging easier.
Basic breakpoints
Breakpoints tell the browser to pause execution and hand over explicit control over how to continue execution to the developer.
To add a breakpoint, first open Chrome’s developer tools and navigate to the Sources tab.
Once a JavaScript file is open clicking on the line numbers on the left is going to add a breakpoint:
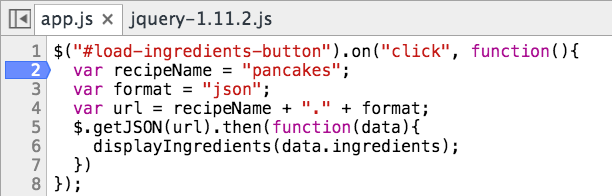
Now every time this line of code is run Chrome will pause, allowing you to view the values of variables in the surrounding code and step through the code manually.
Stepping through code once paused
When a breakpoint is reached Chrome pauses execution and the following execution controls become available:
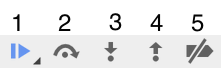
- Resume Script Execution
Continue running the code until the next breakpoint is reached. - Step Over
When the next execution step is a function call, don’t step into the code but continue debugging after the function has finished running (or when a breakpoint is hit inside the function.) - Step Into
Continue stepping through the next function call - so you can follow the steps that happen inside that function. - Step Out Continue debugging after the current function call has finished.
- Deactivate breakpoints Stop debugging/pausing on breakpoints. Click again to re-enable breakpoints.
After a step has been executed by Chrome you have access to the local variables and can use the console to determine if other values are as expected (e.g. a function return value.)
When clicking and holding the “Resume Script Execution” button a Resume with all pauses blocked for 500ms option appears. This is useful when setting a lot of breakpoints in related code but that code isn’t relevant right now. (Chrome calls this feature “Long Resume”.)
Continue to here
When right-clicking the line numbers in the source view, while execution is paused, Chrome also offers a “Continue to here” menu item:
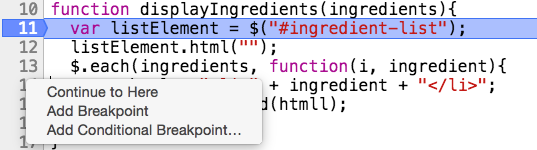
This in effect sets a temporary breakpoint, resumes script execution, and then removes that temporary breakpoint when it is reached.
Breaking on exceptions
On the right of the execution controls is a button that allows you to pause execution when an exception is raised. The advantage of this over just looking at the error message in the console is that you will have access to the surrounding variables at the time the exception was raised.
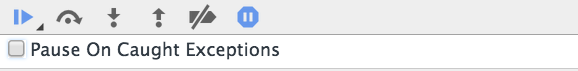
By default if an exception is triggered inside a try catch block it won’t make Chrome treat the exception as a breakpoint. To change this behavior use the checkbox shown in the screenshot.
This feature is useful with JavaScript frameworks that swallow exceptions inside HTML templates for example.
Conditional breakpoints
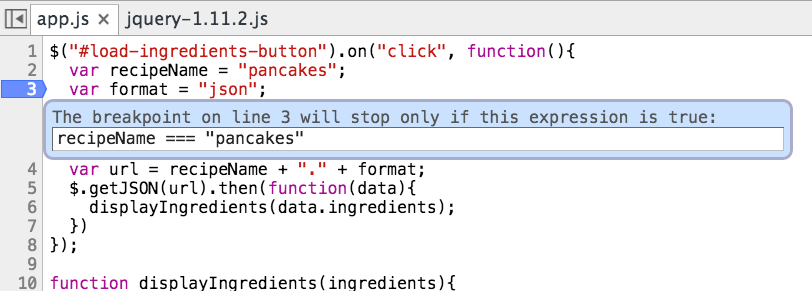
With conditional breakpoints you can tie whether Chrome pauses to a specific condition, basically an if statement for the breakpoint.
To set a condition right-click on a breakpoint and choose “Edit Breakpoint”:
The debugger statement
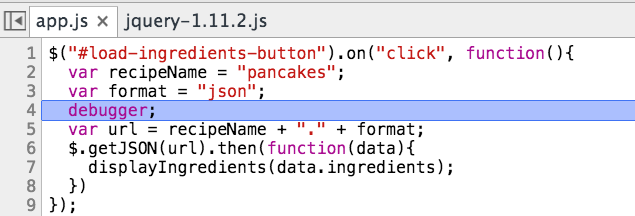
debugger statements embedded in JavaScript code behave exactly like breakpoints created inside Chrome. They make it easier to pause in the right place, especially if you already have your code editor open. When Chrome reaches the statement it pauses execution:
Another use case for debugger statements is inside the Chrome console. Suppose you want to debug the global function displayIngredients, you could run this code in the console to step through it:
debugger; displayIngredients(["test", "ingredients"]);
Breaking when a specific browser behavior occurs
Chrome can also pause when specific actions are triggered, for example an Ajax request or an event.
DOM breakpoints
These breakpoints pause execution when the HTML code for an element is modified. The breakpoint is attached to a DOM node by right-clicking on an element in the Elements panel and selecting “Break on…”.
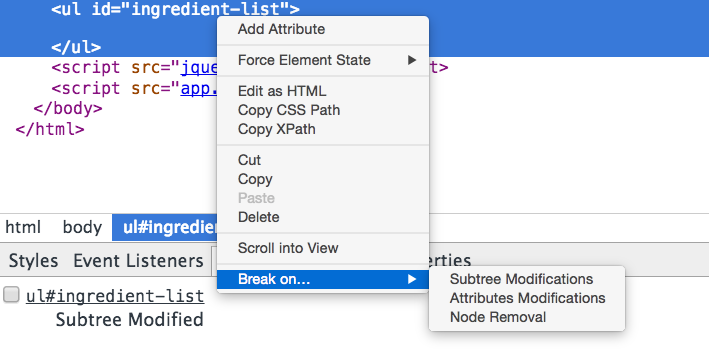
You can break on the following DOM changes:
- Subtree Modifications Pause when the element is emptied or a child element is added.
- Attribute Modifications Pause when for example a class or a data attribute changes.
- Node Remove Pause when the element you’ve selected is removed from the DOM.
This feature allows you to understand why certain changes occur on the page, especially when working on a complex application with many modules.
XHR/Ajax breakpoints
XHR breakpoints pause execution when the client requests more data from the server. Go to the Sources tab to add this type of breakpoint, it’s below the execution controls.
Event Listener breakpoints
These let you find any event handlers that are listening to a specific event and pause running the script when the event occurs. Since you’ll usually be using a library like jQuery to attach events it’s helpful to enable Blackboxing as described below to skip through the jQuery code right to your own event handlers.
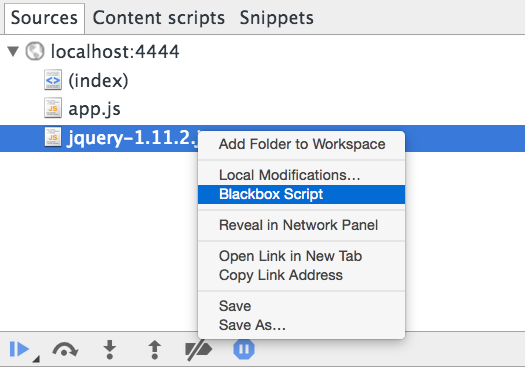
Blackboxing / Framework debugging
Blackboxing lets you disable stepping into certain JavaScript files, most often library code like jQuery. When jQuery calls a function in your code you don’t have to step trough jQuery code until you reach your own file, instead Chrome will just continue execution until your code is reached.
Asynchronous call stacks
When an asynchronous call is made before a breakpoint, the call stack is usally lost. Enabling Asynchronous call stacks via the checkbox in the picture below tells Chrome to persist the call stack and execution context from when the asynchronous call was made.
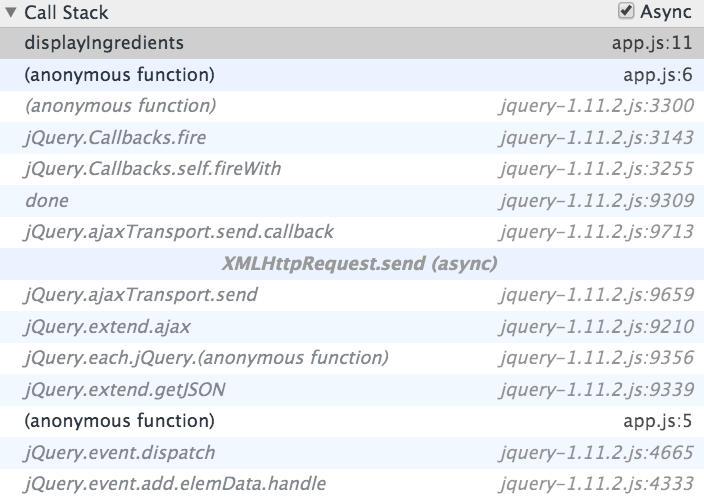
In the screenshot above you can see that an Ajax call was made and then jQuery passed the response on to another function in app.js. Thanks to asynchronous call stacks it’s still possible to investigate how the Ajax call was made if a problem arose in the response callback.
