The developers working on Chrome at Google recently opened a pull request on the Node project to “add v8_inspector support”.
There are already a bunch of Node debugging tools out there. Many of them re-use the DevTools frontend code for their UI. However, behind the scenes they work differently from the normal DevTools.
This post explains how Node Inspector works and how the new node --inspect command is different.
The native Node debugger
Node already ships with an integrated debugger. However, it doesn’t have a GUI, so you need to use the command line version.
You can launch this debugger using node debug.
$node debug test.js
< Debugger listening on port 5858
debug> . ok
break in test.js:1
> 1 var a= 5;
  2 a = a*a
  3 a += 2;
debug>
It shows you where it’s paused and then lets you control execution with commands like next and cont.
debug> next
break in test.js:2
  1 var a= 5;
> 2 a = a*a
  3 a += 2;
  4
The repl and watch commands allow you to see the values of local variables.
What does Node Inspector do?
Node Inspector allows you to use the DevTools user interface with the native Node debugger.
However, there’s one problem: The native Node debugger uses a protocol called V8-Debug, while DevTools uses the Chrome Debugging Protocol.
That means Node Inspector has to step between the two and translate.
Connecting to the Node process
If passed the --debug option the Node process will expose the debugger connection on a port, rather than directly on the command line.
$ node --debug-brk test.js
Debugger listening on port 5858
That means a different process can connect to it.
$ node debug localhost:5858
connecting to localhost:5858 ... ok
debug>
This is what Node Inspector does. When you interact with the DevTools UI it has to send V8-Debug commands to the Node process, rather than Chrome Debugging Protocol commands.
What does adding v8_inspector support to Node do?
v8_inspector is “is an implementation of the DevTools debug protocol”. That means DevTools can now connect directly to the Node process!
(I’m using a locally compiled ./node binary.)
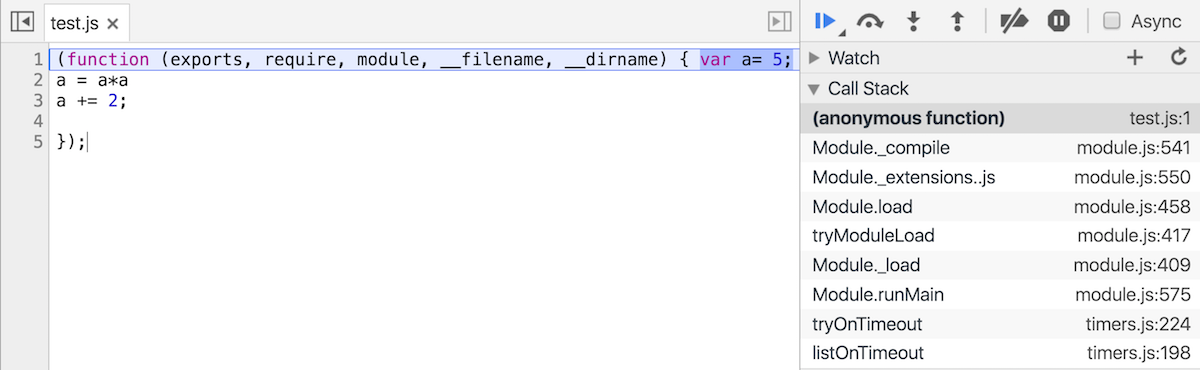
$ ./node --inspect --debug-brk test.js
Debugger listening on port 5858.
To start debugging, open the following URL in Chrome:
    chrome-devtools://devtools/remote/serve_file/@521e5b7e2b7cc66b4006a8a54cb9c4e57494a5ef/inspector.html?experiments=true&v8only=true&ws=localhost:5858/node
Debugger attached.
--inspect tells Node to expose the new debugging protocol, --debug-brk means Node will wait for DevTools to connect before starting execution.
It’s still being decided whether the --inspect command will be added to Node v6 or if it will only become available with v7.
