Chrome has a setting that allows you to include native functions when running the profiler.
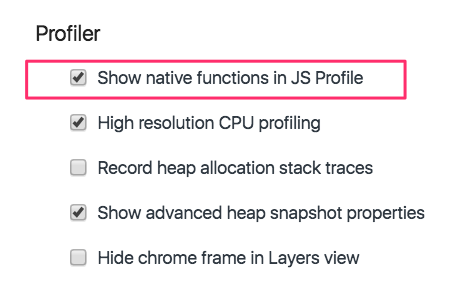
Native functions are part of the JavaScript language, rather than custom application code. Normally they are filtered out when viewing the call stack in the profiler, presumably because you ‘d expect to only see code that’s actually part of your application.
When capturing a call stack Chrome doesn’t actually capture stack frames for functions that are written in C++. However, some native functions are actually written in JavaScript itself.
V8 implements a large subset of the JavaScript language’s built-in objects and functions in JavaScript itself. For example, you can see our promises implementation is written in JavaScript. Such built-ins are called self-hosted.
If you enable the “Show native functions” setting Chrome will show these functions in the profiler output.
A note on how the Chrome profiler works
To find out where your code is spending the most time, the profiler captures a stack trace every 100 μs.
This means that, if a function only takes 50 μs to execute, it may not show up in the profiler at all!
When profiling for more than a few milliseconds you’ll get an accurate understanding of where your app is spending the most time. However, as you zoom in, the information becomes less accurate.
The profiler isn’t consistent either. It will produce a slightly different result every time you run it. Sometimes a very short function call may be recorded, other times it may be missed.
For the purposes of this blog post I’m showing the profiles that are most convenient to demonstrate capturing native functions. When you run the code yourself the results may look different.
Array.join
So let’s try this out! This is the code I’m running:
var arr = []
for (var i=0; i<1000; i++){
arr.push(i)
}
console.profile("Array.join")
arr.join(",")
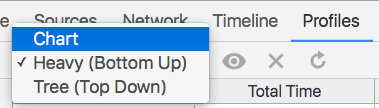
console.profileEnd("Array.join")Select the “Chart” view in the profiler.
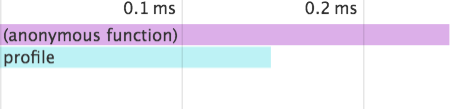
First, without “Show native functions” enabled:
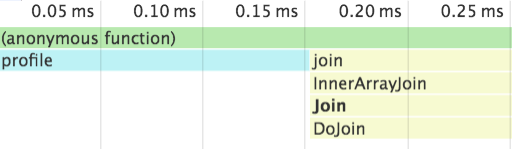
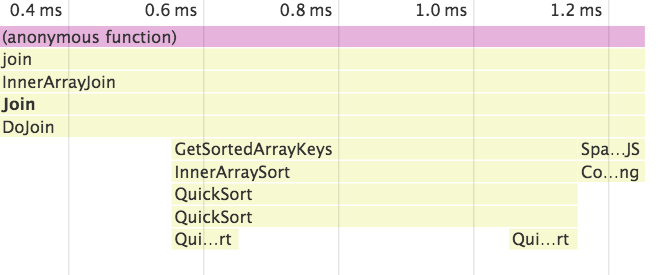
Then after enabling it:
When we hover over the individual function call we can get a more detailed location in the source code.
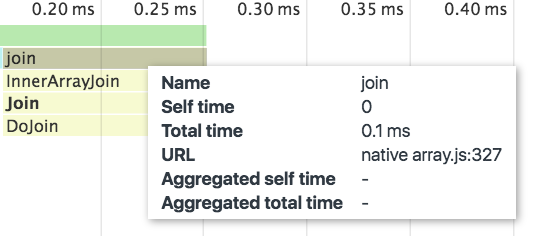
We can now head over to the Chrome code search and look for “array.js”. The line number won’t be exact though, since the code Chrome is running is likely slightly older than what you find on the Chromium master branch.
You can see that ArrayJoin is calling through to InnerArrayJoin:
function ArrayJoin(separator) {
  CHECK_OBJECT_COERCIBLE(this, "Array.prototype.join");

  var array = TO_OBJECT(this);
  var length = TO_LENGTH(array.length);

  return InnerArrayJoin(separator, array, length);
}
InnerArrayJoin calls Join which calls DoJoin.
DoJoin then calls %StringBuilderJoin, which is implemented in C++.
Sparse Arrays
We’re steering a bit off-topic, but I think it’s quite fascinating how V8 deals with sparse arrays (new Array(n)).
Why is this useful?
What does this code do?
arr = new Array(10000000)
for (var i=0; i<10000; i++){
    arr.push(i)
}
console.profile("arr + arr")
arr + arr
console.profileEnd("arr + arr")
It’s not immediately clear. You don’t normally perform an addition on two arrays. But for some reason some code I looked at recently did that.
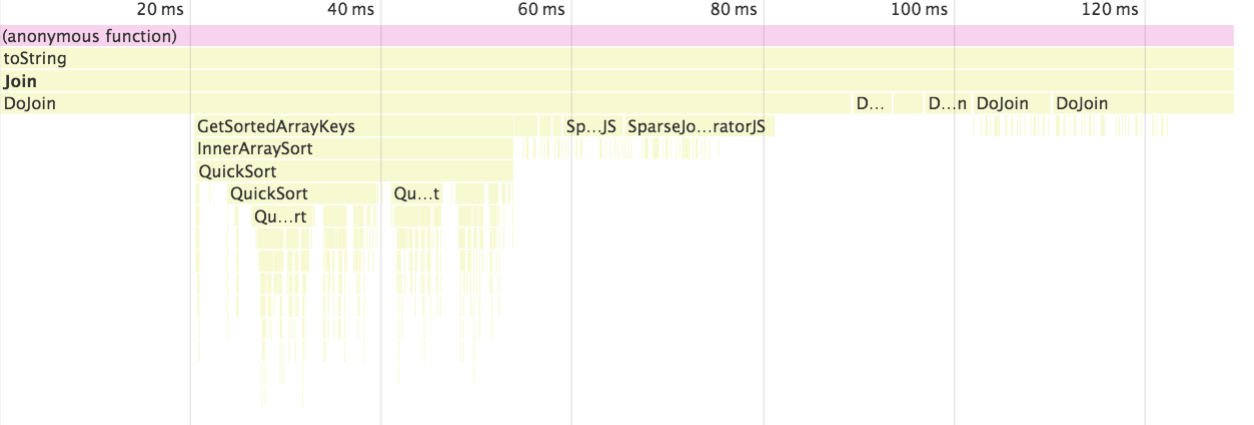
Without being able to see native functions all you get is an anonymous function call.

However, native functions reveal that a whole lot is going on. Chrome is stringifying the array by calling join on it.
Error().stack
Let’s look at a different example. In JavaScript you can use Error().stack to obtain a stack trace at the currently running function.
Two separate things happen when we run that code. First we create a new Error object, then we access its stack property.
Obtaining the string version of the stack trace takes a significant amount of time.
I was able to speed up some code I was working on by obtaining an Error object, but only resolving its stack property when I wanted to display the stack trace.
Inaccuracy
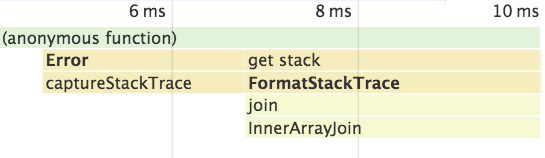
At the top of my post I mentioned how looking at small intervals gives inaccurate results. Just to illustrate that, here’s another profile I captured running Error().stack.
FormatErrorString didn’t show up in the previous example!
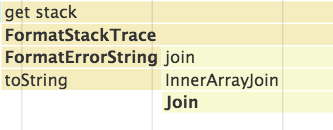
(The total execution time here is ~1ms, which means Chrome took 10 samples of the call stack. The example above took ~10ms because I called Error().stack 10 times in a loop.)
